MICROCEPHALY INFANT MORTALITY IN BRAZIL BEFORE ZIKA OUTBREAK.
MORTALIDAD INFANTIL POR MICROCEFALIA ANTES DEL BROTE DE ZIKA EN
BRASIL.
MORTALIDADE INFANTIL DEVIDO À MICROCEFALIA ANTES DO SURTO DE ZIKA
NO BRASIL.
José Edgardo Dipierri1, Lavinia Schuler-Faccini 2, Valeria Fernanda Chapur3, Rubén Adrián
Bronberg4.
1- Universidad Nacional de Jujuy. Instituto de Biología de la
Altura; Jujuy, Argentina.
2- Universidade Federal do Rio Grande do Sul. Departamento de
Genética; Porto Alegre, Brasil. Hospital de Clínicas de Porto
Alegre. Serviço de Genética Médica; Porto Alegre, Brasil.
3- Universidad Nacional de Jujuy.
Instituto de Ecoregiones Andinas. Instituto de Biología de la
Altura, Consejo Nacional de Investigaciones Científicas y Técnicas;
Jujuy, Argentina.
4- Hospital General de Agudos Dr. José María Ramos Mejía.
Área de Genética Médica y Poblacional, Unidad de Neonatologia;
Buenos Aires, Argentina.
Email de contacto:
rabronberg@intramed.net
Conceptos clave:
A) What is known about the subject?
As from 2015, an increase in Zika cases and infants with microcephaly
has been recorded in Brazil. However there is scarce information on
microcephaly in Brazil before the Zika outbreak.
B) What does this work contribute?
The analysis of the temporal and spatial distribution pattern of child
deaths from microcephaly may provide evidence about the behavior of
microcephaly in the Brazilian population before the Zika outbreak.
Abstract:
Introduction: We present temporal and spatial variation of deaths from
microcephaly in children under 1 year of age is analyzed at regional,
state, and municipal level in the pre-Zika period in Brazil.
Materials and Methods: Data on births and deaths of infants with
microcephaly was obtained from DATASUS from 1996 to 2013. Infant
mortality rate from microcephaly (IMR-M) was estimated at Region,
Federative Unit (UF), and Municipality level. Secular trend (ST) and
risk of death variation were estimated using a Poisson regression
model. Satscan software was used to obtain a statistic spatial scan for
the Poisson model.
Results: IMR-M shows a non-significant negative ST in the Southeast,
South and Central West Regions of Brazil. A greater IMR-M risk of death
variation is found in the North and Northeast Regions. Most UFs in the
Southeast, South and Central West Regions showed a negative ST, in
contrast to what occurs in the UFs of the North and Northeast Regions
showed a positive ST. Six high risk significant clusters were found: 3
in the North-Northeast and 3 in the South-SouthWest-Center-West.
Conclusions: The North and Northeast Regions showed positive ST for
IRM-M and higher death risk, which was not observed in the other
regions. Cluster distribution for higher IMR-M and risk resembles the
distribution of the microcephaly and Zika cases in the outbreak period.
Keywords:
infant mortality; microcephaly; Brazil.
Resumen:
Introducción: Presentamos la variación temporal y espacial de las
muertes por microcefalia en niños menores de 1 año de edad que se
analizan a nivel regional, estatal y municipal en el período pre-Zika
en Brasil.
Materiales y métodos: Los datos sobre nacimientos y muertes de niños
con microcefalia se obtuvieron de DATASUS de 1996 a 2013. La tasa de
mortalidad infantil por microcefalia (TMI-M) se estimó a nivel de
Región, Unidad de Federativa (UF) y Municipio. La tendencia secular
(TS) y la variación del riesgo de muerte se estimaron utilizando un
modelo de regresión de Poisson. El análisis estadístico espacial fue
realizado por un modelo de Poisson utilizando el software Satscan.
Resultados: La TMI-M muestra un TS negativo no significativo en las
regiones sudeste, sur y centro-oeste de Brasil. Una mayor variación de
riesgo de muerte se encuentra en las regiones Norte y Noreste. La
mayoría de las UF en las regiones Sureste, Sur y Centro-Oeste mostraron
un TS negativa, en contraste con lo que ocurre en las UF de las
Regiones Norte y Noreste mostraron una TS positiva. Se encontraron seis
agrupamientos significativos de alto riesgo: 3 en el Norte-Noreste y 3
en el Sur-Sur-Oeste-Centro-Oeste.
Conclusiones: Las regiones Norte y Noreste mostraron una TS positiva
para la TMI-M y un mayor riesgo de muerte, que no se observó en las
otras regiones. La distribución de los agrupamientos de mayor TMI-M y
riesgo se asemeja a la distribución de los casos de microcefalia y Zika
en el período del brote.
Palabras clave:
mortalidad infantil; microcefalia; Brasil.
Resumo
Introdução: Apresentamos a variação temporal e espacial das mortes por
microcefalia em crianças menores de um ano de idade analisadas nos
níveis regional, estadual e municipal no período pré-zika no Brasil.
Materiais e métodos: Os dados sobre o nascimento e morte de crianças
com microcefalia é obtido DATASUS 1996 a 2013. A taxa de mortalidade
infantil por microcefalia (IMR-M) foi estimada região nível, UF (UF) e
município. A tendência secular (ST) e a variação do risco de morte
foram estimadas usando um modelo de regressão de Poisson. A análise
estatística espacial foi realizada por um modelo de Poisson utilizando
o software Satscan.
Resultados: O IMR-M mostra um ST negativo não significativo nas regiões
sudeste, sul e centro-oeste do Brasil. Uma maior variação no risco de
morte da IMR-M é encontrada nas regiões Norte e Nordeste. A maioria das
UF nas regiões Sudeste, Sul e Centro-Oeste apresentou um ST negativo,
ao contrário do que ocorre na UF das Regiões Norte e Nordeste, que
apresentou um ST positivo. Seis grupos significativos de alto risco
foram encontrados: 3 no Norte-Nordeste e 3 no
Sul-Sul-Oeste-Centro-Oeste.
Conclusões: As regiões Norte e Nordeste apresentaram um ST positivo
para RM e um aumento do risco de morte, o que não foi observado nas
demais regiões. A distribuição dos grupos de maior IMR-M e risco
assemelha-se à distribuição dos casos de microcefalia e zika no período
do surto.
Palavras-chave: mortalidade infantil;
microcefalia; Brasil.
Introduction
In March 2015, Campos et al.1 identified a Zika virus
infection - a flavivirus transmitted by Aedes mosquitoes - in Brazil,
associated with a recent ongoing outbreak in Camaçari, Bahia, Brazil.
This outbreak appeared in the dengue virus dispersal area. Since then,
its spread has been confirmed in the five regions of the country, thus
featuring an outbreak2. The Brazilian national authorities
estimate that up to a 1.5 million cases of Zika virus infection have
occurred since the outbreak began3.
In September 2015, reports about an increase in the number of children
born with microcephaly in the areas of the country affected by the Zika
virus began to appear4. In November 2015, the Brazilian
Ministry of Health suggested a relationship between Zika virus and the
microcephaly outbreak in the Northeast. The Evandro Chagas Institute in
Belen forwarded the results of tests carried out on a baby born in
Ceará with microcephaly and other congenital malformations. The
presence of the Zika virus was identified in blood and tissues of this
baby5.
Acknowledging the magnitude of the problem, a register of new cases of
microcephaly was established by the government of Brazil through the
Ministry of Health6, and a Scientific Working Group on Zika
Virus through the Ministry of Science Technology and Innovation. An
epidemiologic report of the Ministry of Health on suspected cases of
microcephaly related to Zika virus ZIKV, updated as at August 27, 2016,
details that 9,172 suspected cases were reported until that date in
newborns from 1639 municipalities from 27 Federative Units7.
According to one report8, 5,909 suspected cases of
microcephaly were reported between July 2015 and February 2016,
including newborns and fetal losses (6%), where 1501 cases completed
clinical, laboratory and image examinations. Of these 1501 cases, 40.1%
(n=602) were classified as confirmed cases of microcephaly, the
remaining 899 cases were ruled out, and 3670 suspected cases continue
under evaluation. In this communication8, Zika virus or IgM
positive results in cerebrospinal fluid (CSF) were detected in 76
babies, including two fetal losses.
In February 20169, WHO states that the recent cluster of
microcephaly cases and other neurological disorders reported in Brazil,
following a similar cluster in French Polynesia in 2014, constituted a
Public Health Emergency of International Concern (PHEIC).
Rasmussen et al. recognized the association between prenatal exposure
to ZIKV and brain disruption10. Martines et al.11
describe evidence of a link between Zika virus infection and
microcephaly and fetal demise through detection of viral RNA and
antigens in brain tissues from infants with microcephaly and placental
tissues from early miscarriages. Calvet et al.12 detected
the Zika virus genome in the amniotic fluid of two pregnant women.
Although an association between microcephaly and congenital infection
by Zika has been confirmed, the real magnitude of this increase is
still controversial. In addition, apparently there is evidence of a
seasonal increase in microcephaly in newborns in Paraiba (Northeast
Brazil), one of the nine States within the epicenter of the epidemic,
before the 2015 Zika outbreak. Sousa Soares de Araújo et al. 13 collected the occipital-frontal head circumference from
16,208 neonates born between January 1st, 2012 and December
31st, 2015 in 21 different public health centers from
Paraíba. In this study, regardless of the classification criteria used,
a higher incidence of microcephaly between 2012 and 2015 was
demonstrated.
Considering this issue, Barreto et al.14 deems necessary to
enlarge the basis of evidence of infection, diseases, and potential
outcomes, among other aspects, to go deeper into the epidemiologic
understanding of microcephaly and Zika. Since no sufficient information
on microcephaly prevalence in newborns in Brazil before the Zika
outbreak exists, reference to other apparently unrelated data sources
that might also contain important information is necessary15
.
This study analyzes temporal (1996-2013) and spatial variation of
deaths from microcephaly in children under one year old in Brazil at
Region, Federative Unit, and Municipality level. The analysis of the
temporal and spatial distribution pattern of child deaths from
microcephaly may provide evidence about the behavior of microcephaly in
the Brazilian population before the Zika outbreak.
Materials and Methods
This ecological and population study gathers information from databases
of births and infant deaths that occurred in Brazil, collected by the
Ministry of Health Information Department of the Unified Health System (Sistema Único de Saúde, Ministério de Saúde) of
Brazil (Datasus) (http://www2.datasus.gov.br/DATASUS/index.php?area=01)
between 1996 and 2013. Information on infant deaths due to microcephaly
came specifically from the Mortality Information System, ( Sistema de Informações sobre Mortalidade, SIM).
Data were analyzed with reference to the maternal place of residence.
The variables used were: a) number of live births (NLB), b) number of
infant deaths (<1 year old) from microcephaly coded by ICD-X (Q002
Code). Based on these figures and regardless of gender, the Infant
Mortality Rate by Microcephaly (IMR-M) (infant deaths from microcephaly
/ 10000 LB) was computed at temporal and spatial levels. At space level
calculations were performed for the whole country, 5 geographic regions
(North, Northeast, Southeast, South and Central West), 27 States
(Rondonia, Acre, Amazonas, Roraima, Pará, Amapá, Tocantins, Maranhão,
Piauí, Ceará, Rio Grande do Norte, Paraíba, Pernambuco, Alagoas,
Sergipe, Bahia, Minas Gerais, Espirito Santo, Rio de Janeiro, Sao
Paulo, Paraná, Santa Catarina, Rio Grande do Sul, Mato Grosso do Sul,
Mato Grosso, Goiás, Federal District) and 5600 municipalities 16. Temporal secular trend (ST) and risk of death variation
for the entire country was evaluated at regional and state levels, with
rates and percentages calculated using a Poisson regression model. In
order to realize the temporal analysis and the applied mathematical
model, the total period was subdivided into three subgroups: 1996-2001
(baseline), 2002-2007 and 2008-2013. In order to detect areas with
rates and percentages of death from microcephaly significantly
different from the nationwide rates and percentages, a cluster analysis
was performed at municipal level using SaTScan v5.1 Software that
allows identification of clusters and verifies whether these are
statistically significant17.
Results
As evidenced in Table 1, IMR-M shows a non-significant
negative ST throughout Brazil, as well as in the Southeast, South and
Central West Regions. In contrast, ST is positive in the North and
Northeast regions, but only significant in the North Region, with an
IMR-M for 2008-2013 (0.267) almost duplicating the baseline for
1996-2001 (0.152). The highest death risk from microcephaly was found
in the North Region, followed by the Northeast, South, Southeast, and
Central West Regions; but the risk is only significant in the North
Region, compared to the baseline (1996-2001). All the Federative Units
of the Southeast, South, and Central West Regions, except Minas Gerais,
showed a non-significant negative ST. In contrast, almost all the
Federative Units of the North and Northeast Regions, except Acre,
Maranhao, Ceará, and Rio Grande do Norte, showed a positive ST only
significant in the States of Amazonas and Bahia. None of the Federative
Units, except the State of Bahía, showed a statistically significant
death risk from microcephaly in children under 1 year of age, compared
to the baseline; however, higher risks (>2) were found in the States
of Rondonia, Amazonas and Piauí, in the Northeast Region. The lowest
risk was found in the Federal District (Table 1).
Table N°1: Infant mortality rate from microcephaly (IMR-M),
Secular trend and Relative Risk in sub-period 2008-2013,
compared to basal sub-period 1996-2001 by Regions and
Federative Units.
|
Region /FU
|
Microcephaly
|
Sub-Periods
|
Secular trend
|
Relative
|
|
|
(n)
|
1996-2001
|
2002-2007
|
2008-2013
|
(1996-2013)
|
risk
|
|
Brazil
|
911
|
0.17
|
0.18
|
0.16
|
-0.001
|
0.96
|
|
|
North
|
105
|
0.15
|
0.16
|
0.27
|
0.046*
|
1.75*
|
|
|
Rondônia
|
12
|
0.11
|
0.25
|
0.38
|
0.071
|
3.45
|
|
|
Acre
|
8
|
0.34
|
0.20
|
0.29
|
-0.022
|
0.85
|
|
|
Amazonas
|
26
|
0.14
|
0.16
|
0.31
|
0.089*
|
2.22
|
|
|
Roraima
|
2
|
0.38
|
0.00
|
0.00
|
0.364
|
-
|
|
|
Pará
|
46
|
0.14
|
0.17
|
0.25
|
0.032
|
1.75
|
|
|
Amapá
|
2
|
0.00
|
0.00
|
0.22
|
0.678
|
-
|
|
|
Tocantins
|
9
|
0.19
|
0.13
|
0.27
|
0.048
|
1.39
|
|
|
Northeast
|
247
|
0.13
|
0.18
|
0.16
|
0.019
|
1.24
|
|
|
Maranhão
|
24
|
0.13
|
0.13
|
0.10
|
-0.066
|
0.53
|
|
|
Piauí
|
19
|
0.11
|
0.21
|
0.30
|
0.086
|
2.87
|
|
|
Ceará
|
40
|
0.16
|
0.21
|
0.13
|
-0.008
|
0.82
|
|
|
Rio Grande do Norte
|
21
|
0.29
|
0.26
|
0.10
|
-0.052
|
0.35
|
|
|
Paraíba
|
15
|
0.06
|
0.27
|
0.09
|
0.003
|
1.36
|
|
|
Pernambuco
|
38
|
0.11
|
0.18
|
0.13
|
0.010
|
1.14
|
|
|
Alagoas
|
13
|
0.10
|
0.11
|
0.15
|
0.05
|
1.52
|
|
|
Sergipe
|
2
|
0.00
|
0.00
|
0.10
|
0.519
|
-
|
|
|
Bahia
|
75
|
0.12
|
0.20
|
0.23
|
0.047*
|
1.90*
|
|
|
Southeast
|
328
|
0.17
|
0.16
|
0.13
|
-0.019
|
0.79
|
|
|
Minas Gerais
|
85
|
0.16
|
0.18
|
0.19
|
0.014
|
1.22
|
|
|
Espírito Santo
|
22
|
0.26
|
0.22
|
0.19
|
-0.010
|
0.74
|
|
|
Rio de Janeiro
|
81
|
0.25
|
0.16
|
0.15
|
-0.033
|
0.61
|
|
|
São Paulo
|
140
|
0.14
|
0.13
|
0.10
|
-0.031
|
0.71
|
|
|
South
|
147
|
0.19
|
0.25
|
0.16
|
-0.012
|
0.81
|
|
|
Paraná
|
68
|
0.21
|
0.32
|
0.16
|
-0.008
|
0.79
|
|
|
Santa Catarina
|
23
|
0.14
|
0.18
|
0.12
|
-0.007
|
0.83
|
|
|
Rio Grande do Sul
|
56
|
0.21
|
0.23
|
0.17
|
-0.017
|
0.83
|
|
|
Central West
|
84
|
|
|
|
|
|
|
|
0.26
|
0.18
|
0.17
|
-0.022
|
0.65
|
|
|
Mato Grosso do Sul
|
24
|
0.28
|
0.50
|
0.20
|
-0.011
|
0.72
|
|
|
Mato Grosso
|
16
|
0.24
|
0.14
|
0.17
|
-0.027
|
0.70
|
|
|
Goiás
|
32
|
0.26
|
0.11
|
0.20
|
-0.004
|
0.79
|
|
|
Federal District
|
12
|
0.28
|
0.07
|
0.08
|
-0.092
|
0.27
|
|
Reference: *p≤0.05, significant level
Fig. 1 shows the distribution of the 6 clusters with a IMR-M
significantly higher than the countrywide, three in the North and
Northeast Regions, and 3 in the South and Southeast Regions. Deaths
from microcephaly in children under 1 year of age were found in only
581 randomly distributed municipalities of the total of 5568 in Brazil,
but there are only 232 (40%) high risk cluster municipalities
distributed in the North and Center-South part of the country. Table 2
shows details about IMR-M, risk, Regions, States, and number of
Municipalities included for each cluster.
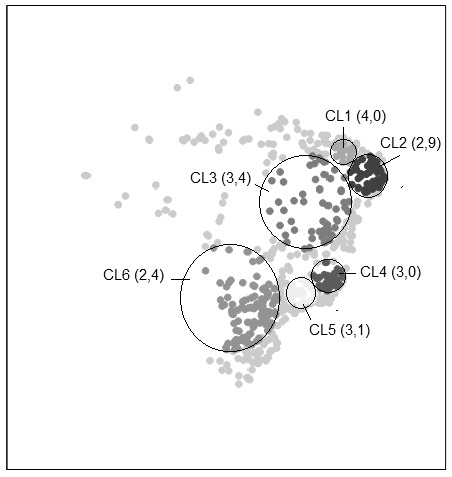
Figure N°1. High risk of rate of infant mortality from
microcephaly (IMR-M) and relative risks (in parentheses) of
clusters (CL) represented in a scatter plot of coordinates.
Table 2: Infant mortality rate from microcephaly (IMR-M), Secular
trend and Relative Risk in Brazil by clusters.
|
Microcephaly
|
Live borns (n)
|
IMR-M
|
Relative Risk
|
Regions
|
Federative Units
|
Municipalities
|
|
(n)
|
*104
|
(n)
|
|
16
|
120926
|
1.32
|
4.00
|
Northeast
|
Ceará
|
15
|
|
Piauí
|
|
55
|
591388
|
0.93
|
2.89
|
Northeast
|
Ceará, Rio Grande, Paraíba, Pernambuco, Alagoas, Bahía
|
46
|
|
62
|
578507
|
1.07
|
3.36
|
North, Northeast Center-Western
|
Pará, Tocantins, Maranhao, Piauí, Pernambuco Bahia,
Minas Gerais, Goiás
|
53
|
|
29
|
297680
|
0.97
|
2.97
|
Southeast
|
Minas Gerais, Espíritu Santo, Rio de Janeiro
|
26
|
|
35
|
346078
|
1.01
|
3.10
|
Southeast
|
Sao Paulo, Rio de Janeiro, Minas Gerais
|
32
|
|
135
|
1828231
|
0.74
|
2.41
|
Southeast, South, Center-Western
|
Sao Paulo, Paraná, Santa Catarina, Rio Grande do Sul,
Mato Grosso do Sul, Mato Grosso, Goiás
|
102
|
Reference: *p≤0.05, significant level
Discussion
Regardless of age, 1,679 deaths from microcephaly occurred in Brazil as a
whole in the analyzed period of time (1996-2013), where 54.2% (911 cases)
refer to children under 1 year of age analyzed herein (Table 1). These
numbers are quite different from of a total reported cases between
2015-2016 (n=10,867), of which 582 (5.3%) evolved to fetal or neonatal
death18. These figures suggest that neonatal mortality from
Zika-related microcephaly is low, and thus the mortality rates from this
cause may only provide fragmentary evidence or a partial view of the
occurrence of this malformation15. However, the percentages of
neonatal mortality in suspected cases of microcephaly provided by COES
contrast with the information provided by ECLAMC19 about the
lethality of this malformation, where the birth death rate in congenital
microcephaly is usually high, since 6% of the cases are stillborn and 24%
suffer neonatal death.
The code assigned by the CIE-10 to microcephaly (Q02) specifically
identifies this malformation as a major isolated structural malformation,
as defined by the International Clearing House for Birth Defect as a
congenitally small cranium, with an occipito-frontal circumference 2
standard deviations below the age- and sex-appropriate distribution curves.
This definition excludes microcephaly associated with anencephaly or
encephalocele. However, in addition to congenital infections, microcephaly
may result from other conditions (chromosomal abnormalities; exposure to
drugs, alcohol, or other environmental toxins; premature fusion of the
bones of the skull or craniosynostosis, and certain metabolic disorders)
with which it may eventually be confused6. The herein provided
information about deaths from microcephaly occurred in Brazil before the
Zika outbreak must be understood in the context of these limitations.
Noteworthy, this analysis took into account the place of residence of the
deceased child and its mother, thus preventing the hospital derivation
phenomenon that occurs when a high complexity hospital starts receiving
prenatally diagnosed cases for the birth, thus altering the actual
prevalence in a specific town or region18.
Taking only the number of deaths from microcephaly into account, the
Southeast Region has the greatest number of cases, followed by the
Northeast, South, and Central West Regions (Table 1). This distribution may
be due to the effect of population size of each of the regions with the
same distribution as the number of cases with microcephaly. However, when
the rate between the number of children’s deaths from microcephaly and the
total population of the region is computed (year 2012) the highest value is
found in the North region (6.4*103), followed by the Central
West (5.8*103), the South (5.3*103), the Northeast
(4.6*103), and the South (4.1*103) Regions.
When IMR-M between sub-periods is compared, a spatial change is found
between 1996-2001 and 2008-2013, characterized by a rate increase in the
North area of the country. Indeed, in the 1996-2001 period, the highest
IMR-M is found in the Central West Region, followed by the South,
Southeast, North, and Northeast Region; in contrast, in the 2008-2013
period, the highest IMR-M is found in the North Region, followed by the
Northeast, Central West, South, and Southeast Regions (Table 1). This
spatial IMR-M change is expressed by a higher and more significant increase
in death risk from this malformation in the North Region, followed by the
Northeast, South, Southeast, and Central West Region, and a positive ST in
the North and Northeast Regions (Table 1).
Noteworthy, the State of Paraíba, where a much higher than expected
incidence of microcephaly was observed (varying from 2% to 8% according to
the classification criteria applied) showed a very low and non-significant
ST, and a decrease in IMR-M in the 2008-2013 period, before the analyzed
period13.
Noteworthy, cluster 1, located in the Northeast and mainly comprising the
municipalities of the States of Ceará and Piauí, shows higher relative risk
(4.0) and IMR-M (1.32) (Table 2). One of the strongest epidemiologic
evidences relating the Zika virus and Microcephaly is expressed by the
temporal and spatial coincidence of the cases of Zika and microcephaly.
Fig. 1 shows that the distribution of the clusters of highest risk of death
from microcephaly is similar to the distribution of the microcephaly cases
recorded in the period 08/11/2015 - 26/03/201620 and the cases
of Zika recorded in the country from April 2015 to the Epidemiologic Week 8
of 201621.
Conclusion
The epidemiology of infant mortality from microcephaly in the 1996-2013
period is characterized by: (1) A temporal and spatial IMR-M variation; (2)
compared with the South Regions, the North Regions show a negative ST of
IMR-M; (3) the North Regions show higher IMR-R than the South Regions; (4)
the municipal clusters with higher IMR-R risk tend to be located in the
North and Central West part of the country; (5) the spatial image of the
clusters with highest IMR-M and risk is similar to the distribution of the
reported cases of microcephaly and Zika since mid-201522.
Conflictos de interés y cesión de derechos
Los autores declaran no tener conflicto de interés, siendo responsables de
lo escrito y cediendo el derecho de autor a la Universidad Nacional de
Córdoba para publicar en la RFCM.
Fuentes de Financiamiento
Este trabajo no ha tenido fuente de apoyo alguna
References
1. Campos GS, Bandeira AC, Sardi SI.
Zika Virus Outbreak, Bahia, Brazil.
Emerg Infect Dis 2015; 21(10):1885–1886.
2. Portal da Saúde. Confirmação do Zika Vírus no Brasil. Ministerio da
Saúde 2015. Available from:
http://portalsaude.saude.gov.br/index.php/o-ministerio/principal/secretarias/svs/noticias-svs/17702-confirmacao-do-zika-virus-no-brasil.
3. WHO 2016. WHO statement on the first meeting of the International
Health Regulations (2005) (IHR 2005) Emergency Committee on Zika virus
and observed increase in neurological disorders and neonatal
malformations. Feb 1, 2016. Available from:
http://www.who.int/mediacentre/news/statements/2016/ .
4. Schuler-Faccini L, Ribeiro EM, Feitosa IM.
Possible Association Between Zika Virus Infection and Microcephaly —
Brazil, 2015.
MMWR Morb Mortal Wkly Rep 2016; 65:59–62.
5. Portal da Saúde. Ministério da Saúde confirma relação entre vírus
zika e casos de microcefalia. Ministerio da Saúde 2015. Available from:
http://portalsaude.saude.gov.br/index.php/cidadao/principal/agencia-saude/21014-ministerio-da-saude-confirma-relacao-entre-virus-zika-e-microcefalia.
6. Schuler-Faccini L, Ribeiro EM, Feitosa IM, Horovitz DD, Cavalcanti
DP, Pessoa A, Doriqui MJ, Neri JI, Neto JM, Wanderley HY, Cernach M,
El-Husny AS, Pone MV, Serao CL, Sanseverino MT.
Brazilian Medical Genetics Society–Zika Embryopathy Task Force Possible
Association Between Zika Virus Infection and Microcephaly - Brazil,
2015.
Morb Mortal Wkly Rep 2016; 65(3):59-62.
7. Portal da Saúde 2016. Centro De Operações De Emergências Em Saúde
Pública Sobre Microcefalias. Informe Epidemiológico Nº 33 – Semana
Epidemiológica (Se) 26/2016 (26/06 A 02/07/2016) Monitoramento Dos
Casos De Microcefalia No Brasil.
Available from:
http://portalsaude.saude.gov.br/images/pdf/2016/julho/08/Informe-Epidemiol--gico-n---33--SE-26-2016--05jul2016-22h30.pdf
8. Franca, G.V., Schuler-Faccini, L., Oliveira, W.K., Henriques, C.M.,
Carmo, E.H., Pedi, V.D., Nunes, M.L., Castro, M.C., Serruya, S.,
Silveira, M.F., Barros, F.C., Victora, C.G. Congenital Zika virus
syndrome in Brazil: a case series of the first 1501 livebirths with
complete investigation. Lancet 2016;27;388 (10047):891-7
9. WHO 2016. Zika situation report. Zika and potential complications.
Available from:
http://www.who.int/emergencies/zika-virus/situation-report/who-zika-situation-report-12-02-2016.pdf?ua=1.
10. Rasmussen, S, Jamieson D, Honein M, Petersen L. Zika Virus and
Birth Defects Reviewing the Evidence for Causality. N Engl J Med 2016;
374:1981-1987
11. Martines, R, Bhatnagar J, Keating M, et al. Notes from the field:
evidence of Zika virus infection in brain and placental tissues from
two congenitally infected newborns and two fetal losses—Brazil, 2015.
MMWR. Morbidity and mortality weekly report 2016; 65.
12. Calvet G, Aguiar RS, Melo AS, Sampaio SA, de Filippis I, Fabri A,
Araujo ES, de Sequeira PC, de Mendonça MC, de Oliveira L, Tschoeke DA,
Schrago CG, Thompson FL, Brasil P, Dos Santos FB, Nogueira RM, Tanuri
A, de Filippis AM. Detection and sequencing of Zika virus from amniotic
fluid of fetuses with microcephaly in Brazil: a case study. Lancet
Infect Dis 2016; S1473-3099(16)00095-5.
13. Soares de Araújo JS, Regis CT, Gomes RGS, et al. Microcephaly in
northeast Brazil: a review of 16 208 births between 2012 and 2015. Bull
World Health Organ E-pub 2016:
14. Barreto ML, Barral-Netto M, Stabeli R, Almeida-Filho N, Vasconcelos
PF, Teixeira M, Buss P, Gadelha PE. Zika virus and microcephaly in
Brazil: a scientific agenda. Lancet 2016; S0140-6736(16)00545-6.
15. Byass P, Wilder-Smith A utilising additional sources of information
on microcephaly. Lancet 2016; S0140-6736(16)00519-5.
16. IBGE 2012. The Brazilian Institute of Geography and Statistics.
Available from: http:// www.ibge.gov.br/home/mapa_site/mapa_site.php.
17. Kulldorff M, Huang L, Konty K. A scan statistic for continuous data
based on the normal probability model.
Int J Health Geogr 2009; 8:58.
18. COES Microcefalia 2016 (Centro de Operações de Emergências em Saúde
Pública Sobre Microcefalias). Informe Epidemiológico Nº 41 – Semana
Epidemiológica (SE) 34/2016 (21/08 a 27/08/2016). Monitoramento dos
casos de microcefalia no Brasil. Ministerio de Saude do Brasil .
Available from: www.saude.gov.br
19. ECLAMC 2016. DOCUMENTO ECLAMC FINAL. Resumo e conclusões dos
Documentos 1-5. Bue, 30 de dezembro, 2015. Available from:
http://www.eclamc.org/microcefaliaarchivos.php.
20. COES Microcefalia 2016 (Centro de Operações de Emergências em Saúde
Pública Sobre Microcefalias). Informe Epidemiológico Nº 41 – Semana
Epidemiológica (SE) 34/2016 (21/08 a 27/08/2016). Monitoramento dos
casos de microcefalia no Brasil. Ministerio de Saude do Brasil .
Available from: www.saude.gov.br
21. Boletim Epidemiológico. Secretaria de Vigilância em Saúde.
Ministério da Saúde 2016; 47 (14).
22. COES Microcefalia 2017 (Centro de Operações de Emergências em Saúde
Pública Sobre Microcefalias). Informe Epidemiológico Nº 47 – Semana
Epidemiológica (SE) 52/2016 (25/12 a 31/12/2016). Monitoramento dos
casos de microcefalia no Brasil.
Ministerio de Saude do Brasil . Available from: www.saude.gov.br
Recibido:
2019-08-15 Aceptado: 2019-09-14
DOI:
http://dx.doi.org/10.31053/1853.0605.v76.n4.21087
http://creativecommons.org/licenses/by-nc/4.0
©
Universidad Nacional de Córdoba