OPERATIONS RESEARCH APPROACH IN THE METHOD OF ANALYSIS AND PROBLEM SOLVING (MASP)

THAIS SILVÉRIO SALVADORI1 - MISCHEL CARMEN N. BELDERRAIN2    

Instituto Tecnológico de Aeronáutica – ITA. São José dos Campos, Brasil

thaissilvasilverio@yahoo.com.br - carmen@ita.br


Fecha recepción: diciembre 2021    Fecha aprobación: abril 2022

ARK CAICYT: http://id.caicyt.gov.ar/ark:/s18539777/p5zjm9klv

ABSTRACT

Currently, with fierce competition in the job market, companies are seeking continuous improvement of their services, seeking to increasingly expand their clientele. In this sense, organizations are increasingly committed to reducing losses and rework. However, problem identification, analysis and solution is a very complex process, in which you need a multidisciplinary team and an efficient process for an effective solution. Thus, the objective of this study is to add to the method of analysis and problem solving (MASP) a structuring step and to use a multicriteria method for prioritizing actions. So, the proposed method uses: (a) MASP method (Problem Analysis and Solution Method) and its respective quality tools with a focus on problem analysis and solution and; (b) the PFM (Problem Focused Method) method with a view to a robust structuring of the problematic situation and, c) the AHP (Analytic Hierarchy Process) method for prioritizing actions. The proposed method was applied in a manufacturing unit during the validation of the implementation of a new process. At the beginning of production there was a high level of rejection of batches and losses in the production process, with the resolution of the problem a rate of less than 1.00% of rejection of batches in the production process was achieved.


KEYWORDS: MASP (Problem Analysis and Solution Method), PFM (Problem Focused Method), problem structuring, multidisciplinary team.


RESUMEN

Actualmente, con una feroz competencia en el mercado laboral, las empresas buscan la mejora contínua de sus servicios, buscando ampliar cada vez más su clientela. En este sentido, las organizaciones apuestan cada vez más por reducir pérdidas y retrabajos. Sin embargo, la identificación, análisis y solución de problemas es un proceso muy complejo, en el que se necesita un equipo multidisciplinar y un proceso eficiente para una solución eficaz. Así, el objetivo de este estudio es añadir al método de análisis y resolución de problemas (MASP) una etapa de estructuración do problema y utilizar un método multicriterio para la priorización de acciones. El método propuesto utiliza: (a) el método MASP (Método de Análisis y Solución de Problemas) y sus respectivas herramientas de calidad con enfoque en el análisis y solución de problemas y; (b) el método PFM (Problem Focused Method) con miras a una estructuración robusta de la situación problemática y, c) el método AHP (Analytic Hierarchy Process) para priorizar acciones. El método propuesto se aplicó en una unidad de manufactura durante la validación de la implementación de un nuevo proceso. Al inicio de la producción se presentó un alto nivel de rechazo de lotes y pérdidas en el proceso productivo, con la resolución del problema se logró una tasa de rechazo de lotes menor al 1.00% en el proceso productivo.


PALABRAS CLAVE: MASP (Método de Análisis y Solución de Problemas), PFM (Método Focalizado en Problemas), estructuración de problemas, equipo multidisciplinario.


1.     INTRODUCTION

World-class companies differ from traditional companies in the way they manage their resources to optimize their competitiveness. The market is always passing through transformations that demand dynamism from organizations looking for quick solutions to problems that are common in operational and management processes. Competitiveness for prices and quality has become increasingly sharp, mainly in countries that have high technology or more expensive manufacturing costs. (Salgado et al 2009).

Seeking the need for customer satisfaction, organizations look for improvements in their methods and processes, aiming at the excellence of their products and services, including in the health sector. So, organizations need to identify and mitigate the factors that cause waste (time, unnecessary activities, rework, etc.) of the processes to reduce the lead time and costs, bringing a competitive advantage to the organization to face other competitors (Salgado et al 2009).

The non-conformity analysis is an inherent process at organizations, especially in companies that have strict environments of quality control, such as the high-volume industries. According to Campagnaro (2007) any process is subject to the occurrence of non-conformities, daily. This fact is due to the high complexity of the processes involved, in addition to innumerable variables that can cause a failure, being practically impossible to have control of all of them. Thus, as we have an environment in which the probability of occurrence of a non-conformity is high, it is necessary to use methodologies to address these problems, such as the probable causes evaluation and corrective actions to reduce the recurrence of causes, to guarantee the quality of the products (Hagemeyer; Gershenson, Johnson 2006). However, problem solving, if not carried out with well-defined planning and aligned with stakeholders’ goals, can, in most cases, bring actions that require a lot of investment (related to cost) and a long term of implementation (related to time).

One of the most used ways in the industry for the treatment of non-conformities is the Method of Analysis and Solution of Problems (MASP). However, the application of the MASP method is directly linked to several human, technological and organizational factors. Aguiar (2004) mentions, for example, imprecision, inadequate training and lack of tools as some characteristics that lead to failures in the application of MASP. Thus, the objective of this study is to improve the method of analysis and problem solving (MASP) by addition of a structuring step and the use of a multicriteria method for prioritizing actions.


2.     LITERATURE REVIEW

2.1.         Problem Analysis Method (MASP) or QC-Story

The Problem Analysis Method (MASP), also known as History of Quality Control (QC-Story), started in Japan in the 1950, resembles the history of quality control activities and has the ability to systematically improve the company's performance through competencies and skills development for organizational solving problems (Castro et al., 2011).

In Brazil, the introduction of QC-Story was carried out by Vicente Falconi Campos who published an appendix describing the method in his book “TQC Total Quality Control in Japanese style”, in 1992 (Henriques, 2013; Versiani; Oribe; Rezende , 2013).

The process to be followed in MASP is based on the Plan-Do-Check-Act (PDCA) cycle, considering that each MASP stage is framed in the stages of the PDCA cycle. Severo, Melo and Medeiros (2004) explain that the method of analysis and problem solving makes use of the PDCA cycle, the only difference is instead using four steps, the MASP is subdivided into eight steps. According to Campos (2004), the method is a congruent series that aims to meet a certain objective, while tools are contributions to make the method effective, as FIGURE 1.

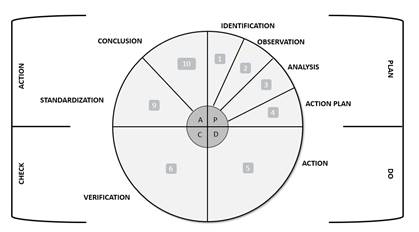
FIGURE 1. MASP cycle. Adapting from Campos (2004).


2.2.         PFM

Problem Structuring Methods (PSM) methods are used where the problem is not in a structured way that means, the elements involved are not clearly identified. According to Mingers and Rosenhead (2004), a complex problem is characterized by the existence of several factors such as: multiple actors, multiple perspectives, conflicting interests, important intangibles, and key uncertainties.

The Problem-Focused Method is derived from several common concepts from PSM, in addition to other theories related to the in-depth study of the problem and decision-making processes. PFM originated with the objective of becoming an aid tool in the initial stages of identifying and structuring a problematic situation, in order to support a clear structuring of the problem based on interviews with those involved and investigations of the variations in the context (Cardoso Junior, 2019).

The maps are constructed from interviews with individuals, and in the end they will be brought together, providing a systemic view of the scenario to be studied (Eden, 2004). Each fact or statement reported by the interviewee is recorded in a box, then the facilitator writes a contrast to this sentence. As in the SODA (Strategic Options Development and Analysis) method, the box is called “construct”, which represent the client's informal knowledge and a contrasting point is given in order to minimize any ambiguity that may exist (Eden, Ackermann, Cropper, 1992.)

Based on the principles described, the problem maps use the concept of bipolarity in order to minimize the ambiguities existing in the interpretative process with the use of words or phrases that aim to reinforce the original description given (Georgiou, 2011). On the positive pole, there is the information provided by the stakeholder. They are separated from the negative pole by three points ("..."), which is intended to minimize the different connotations that the assertions by the client may assume, in order to improve the situational context and maximize understanding.


2.3.         AHP

The Multicriteria method Analytic Hierarchy Process - AHP - emerged in the late 1960s and was developed by the mathematician Thomas L. Saaty, while working for the US State Department's Arms Control and Disarmament Agency.

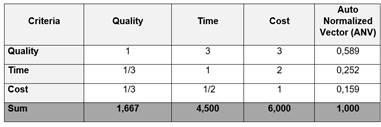
The Analytic Hierarchy Process (AHP) is a method used to assist in problem solving, especially when there are several criteria involved in the assessment. The method allows breaking the complexity of unstructured situations into simpler elements. AHP can be used to classify the importance of the relevant criteria in a decision. (Saaty, 2008). In the AHP method, there are two aspects to obtain priorities, the first is the comparison of an alternative with multiple existing ones (relative measure), while the second, each alternative is compared with the ideal alternative (absolute measure), through a process known as classification of alternatives or Ratings.

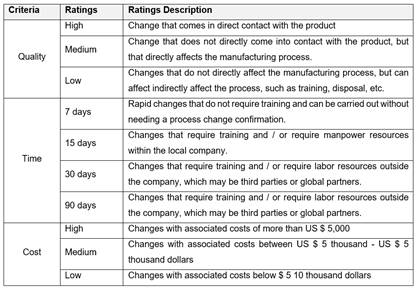
Ratings can be defined as a set of categories (or levels) that assess the performance of alternatives, considering each criterion and / or sub-criterion. It is important to emphasize that the categories should be classified in order to minimize the ambiguity between the criteria / sub-criteria, so that decision makers can distinguish the criteria / sub-criteria for evaluating the alternatives. (Duarte Junior, 2005).

According to Saaty (2008), the best way to work with ratings is by idealizing the priority vectors, in other words, the classification “excellent” receives classification 1 and the subsequent ones receive lower values. The intensity categories are then prioritized using the pairwise comparison and the alternatives are evaluated by selecting the designated intensity category for each criterion.

One of the main advantages of using Ratings is the decrease in the number of comparisons when there are a large number of alternatives. In addition, the use of absolute measures (evaluations), does not interfere if there is an addition or removal of alternatives, as there is no rank inversion in their classification Silva, Belderrain, Pantoja (2010).

In this article, a brief description of AHP with Ratings is presented and its application will be done using an Excel spreadsheet developed for this study.


3.     RESEARCH METHOD

3.1.         Description of the proposed method

The proposed method promotes the cause analysis with greater objectivity and with the insertion of the facts in a chronological way, through the application of the PFM – Problem Focused Method – and the construction of the problem maps. The proposed method can be demonstrated in FIGURE 2.   


Gráfico, Diagrama

Descrição gerada automaticamente

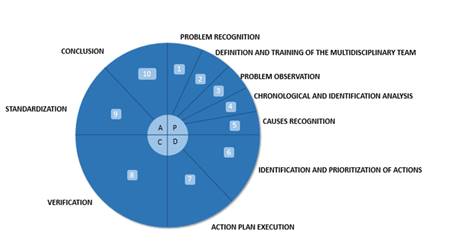
FIGURE 2. Proposed MASP method. Source: Author.


·         Step 1: Problem Recognition: This step shows the process flowchart for a better understanding of the problem to be analyzed. Subsequently, the problematic situation is recognized, which is evidenced by the defect rate indicator per lot.

·         Step 2: Definition and training of the multidisciplinary team, the multidisciplinary team that works to solve the problem and train all individuals in the tools applicable to the proposed method is defined, mainly in the MASP, PFM and AHP tools.

·         Step 3: Problem Observation: This step consists of stratifying the problematic situation in the first step, in order to identify which defects are being found that affect the quality of the product and using quality tools to determine which defect will be solved using the proposed method.

·         Step 4: Chronological and identification analysis: It is the most complex step of the method because it is the main step of analyzing problem solutions, the cause analysis. Firstly, for the analysis of causes, they are carried out using the problem maps using PFM method, where it was divided into 3 stages: Interviews and Constructions of the individual Maps, Construction of the Aggregated and Congregated Map and Qualitative and Quantitative Analysis of the Congregated Map.

·         Step 5: Causes Recognition: The causes identified in the PFM stage are placed for a better visualization of the causes through the Ishikawa Diagram, and a group vote on the main causes that need to be analyzed.

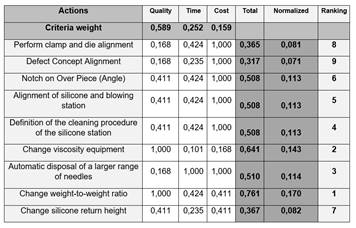
·         Step 6: Identification and Prioritization of Actions: Generate the necessary corrective actions with deadlines and those responsible for execution. These actions are prioritized using the AHP Method.

·         Step 7: Action Plan Execution: The actions, already prioritized, are implemented and the deadlines and those responsible are defined for the execution.

·         Step 8: Verification: The action plan is now executed, with subsequent verification of its effectiveness through the analysis of the results obtained.

·         Step 9: Standardization: Communication changes of the standards in a systematic way with details of each stage, locations and stakeholders can be carried out through an official document or channels.

·         Step 10: Conclusion: Completion of the work and recognition of those involved.


3.2.         Application of the proposed method

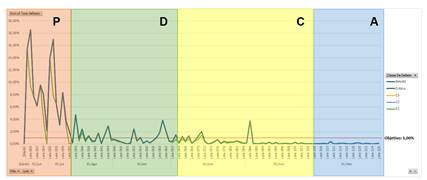
3.2.1.     Step 1: Problem Recognition

The Problem Recognition and the understanding of the problem to be analyzed is facilitated by the process flowchart in FIGURE 4. In this application, the problem occurs within a medical device company, but specifically with surgical needles. The surgical needle is designed to take the surgical thread, penetrating it through tissues.

To facilitate the understanding of the flow of the product manufacturing process and to understand when the information to detect the problem was found, FIGURE 3 depicts the process flowchart.


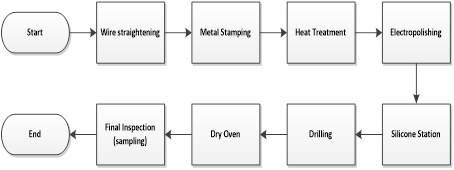
FIGURE 3. Process Flowchart. Source: Author


These materials would not go through the Final Inspection process, so it was decided to do the same sampling as the Final Inspection right after the drilled needles process in order to know the process robustness through the defect rate indicator.

The release of the products of the products at the Final Inspection is carried out using the technique of sampling inspection, thus having acceptable levels of quality for the batch. Thus, the same sampling that is current applied in the Final Inspection stage was replicated for the process.

Quality levels represent the percentage of defective parts that the process is producing in relation to a particular defect. Quality levels will be considered accepted if, and only if, the defective fraction is less than a Specified Acceptance Quality Level (Spec-AQL) for the defect found.  The classification of a defect is directly related to the effect that non-compliance impacts the patient. In this article, the defect to be addressed is the Class 1 defect, in which it will not cause serious injury or illness to the customer but could render the product useless or difficult to use. The Spec-AQL for this type of classification is 1.0%, that is, the number of detectable samples in the sample cannot be greater than 1.0%. FIGURE 4 shows the high rate of defects found in the lots through Inspection by sampling.


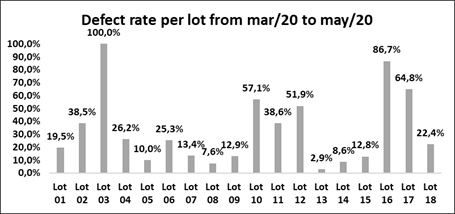
FIGURE 4. Process Flowchart. Source: Author


Thus, the problem of a high number of defects was detected in this phase, it was demonstrated that process need improvements to ensure quality required by internal and external customers, which consisted of finding no defects at this stage of the process. Therefore, the Quality Sector reacted to this demand and developed strategies on how to solve the problem for the coming months, as well as a definition of better collection of defective data.


3.2.2.      Step 2: Definition and Training of the Multidisciplinary Team


A multidisciplinary group, formed by specialists from different areas, was created to analyze and find the possible causes of the problem. Thus, the multifunctional group had the involvement of the following areas:

·         Process Engineering - 1 representative

·         Quality Engineering - 1 representative (facilitator)

·         Development Engineering - 1 representative

·         Production - 1 representative

These people were designated by the management, as they participated in the transfer of technology to the website, as well as in the development of processes and validations. The group leader, a member of Quality Engineering, was responsible for preparing and managing the discussions, as well as for stratifying the data to share the problem with the group.


3.2.3.     Step 3: Problem Observation


The observation of the problem occurred in order to stratify which were the Class I defects. Previously, the collection of information on inspection defects happened informally, in which the main information obtained was the defect rate. From these lots, an inspection checklist was created in order to identify, quantify and classify the defects found, according to applicable rules.

In order to obtain this information for the analyzed lots, a resampling was carried out to obtain these stratified data. The checklist presents the product code, lot number, tray number, defects (quantity, code, classification), operator, and date. The standardized classifications help to find the region, or the form of the problem contained in the product, as well as the classification of the defect.

Thus, with the means of identification established, it was possible to stratify the sampled lots, the sum of the defects for each batch is above acceptable levels, so the batches would fail. In addition, it was found that most of the defects found are Class I, that is, a defect in which it may imply a serious injury to the client, the lowest rate found for Class I was 2.9%.

Data stratification continued through the Pareto Graph to find out which defect was most frequently negatively impacting the product, as shown in FIGURE 5.

Gráfico

Descrição gerada automaticamente com confiança média

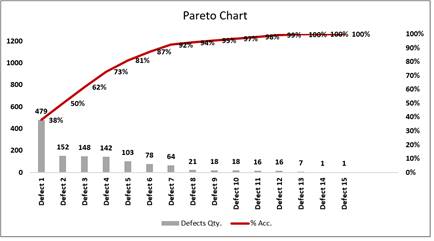
FIGURE 5. Pareto diagram for defects. Source: Author

As can be seen, 80% of the defects are defects 1,2,3,4 and 5. The study in question focuses only on Defect 1, as the other defects had the causes and actions already underway by the team, for example. if it is a problem of simple resolution, then only Defect 1, called Incorrect Silicone, was addressed. The remaining defects were not explained to preserve the company's image.


3.2.4.      Step 4 - Chronological and Identification Analysis


3.2.4.1.         Step 4.1: Interviews and Construction of Individual Maps

The objective of the interviews with the multidisciplinary team was to understand each stage of the process and the difficulties that exist in them. In addition, the focus of individual interviews was so that there was no loss of information and did not discard any findings at that first moment.

The subjects covered in the interview were conducted in a semi-structured manner, so that some important topics could be addressed, but always giving due attention to the areas covered by the interviewee. The understanding of the activities and difficulties present in the process was also another relevant aspect taken into account in the interviews.

Contributions and responses appeared continuously and spontaneously, and the interviews lasted an average of one hour. It is worth mentioning that in the interview process, the relationships were carried out without the negative pole of the constructs to avoid confusion in the sequencing of causality and to let the interviewee's ideas flow. The negative poles were carried out by the facilitator, who knows the process, and when there were doubts, they were obtained by questioning the constructs, to understand the meaning of what the interviewee would like to say, thus eliminating possible ambiguities.

Subsequently, the problem maps were placed in the Decision explorer software, listing all constructs related to each interview and establishing the cause and effect and interdependence relationships. To finalize the process of individual maps, the constructs were grouped in Clusters and the logical consistency of the maps was verified. Thus, the maps were presented to representatives of the multidisciplinary team so that they could review the points discussed in the interview and verify the logical sequence between the constructs. Some adjustments were necessary, being made at the same time by the facilitator.

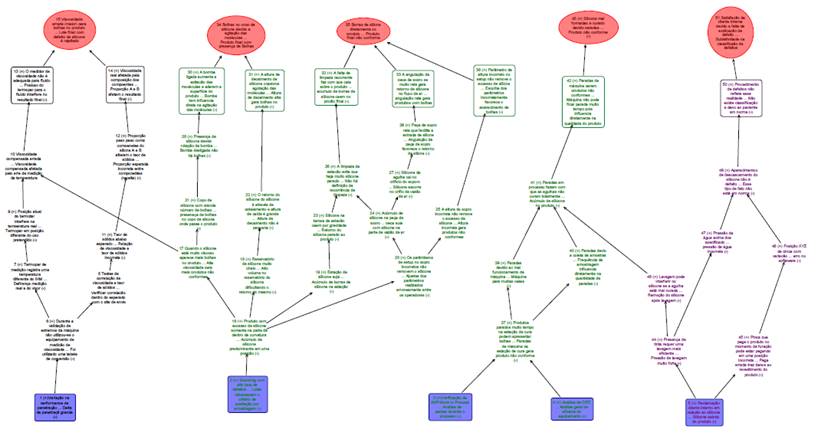
To preserve the identity of those involved and the company, the individual maps were not presented in this work. For papers purpose will be presented just the congregated map, the FIGURE 7 will be showed just in original language of interviews for maintain originality, but all causes identified from congregated map are described into section 3.2.5.


3.2.4.2.   Step 4.2: Construction of the Aggregated and Congregated Map

The individual maps, already validated with their respective interviewee, were unified into a single map with the identification of Clusters. After this unification, 3 Clusters were identified: standardization (black), process (green) and performance (purple).


Diagrama

Descripción generada automáticamente


FIGURE 6- Final congregated map. Source: Author.


After the alignment meeting with the multidisciplinary team, the aggregate map was adjusted to obtain the final congregated map. The final congregated map is shown in FIGURE 6, in reduced size. The final map is composed of 51 constructs, 4 of which are starter type, 9 of problem type and 2 of effect type.


3.2.4.3.         Step 5: Causes Recognition

In this step, the data collected, and the map collected with the participation of all members of the multidisciplinary group were verified and discussed. The idea of building a cause-and-effect diagram is not to brainstorm the facts that have occurred and to discuss them again, as this has already been done in the PFM stage.

Defining all the probable causes of the problem, no possibility was disregarded, as, as already informed, this is a new process and people are in the learning phase with the validated process and equipment. Thus, an open and individual vote was taken with all members of the group to obtain the possible “root cause” of the problem. The purpose of voting is to attack the main causes of the problem, by the group and monitor the evolution of quality indicators. If these actions are not being effective, they can go back to that stage to include more causes to be attacked. So, after the vote, the main “root causes” chosen by the group were:

·         Sample Collection (Stops);

·         Disagreement in the classification of defects between operators;

·         Wrong thermocouple of the viscosity measuring device;

·         Lack of definition of cleanliness in the procedure;

·         Blow and product alignment;

·         Incorrect clamp positioning on making product hole;

·         Angled blow piece that favors the appearance of the defect.


3.2.4.4.         Step 6: Identification and Prioritization of Actions

From the definition of the main causes to be attacked, actions were defined for each one of them. The actions were segmented according to the root cause and assigned to the person responsible for executing the team according to the technical capacity and knowledge of the process. The action plan spreadsheet was also used for periodic monitoring of actions during weekly meetings to support the process.

As the issue of resources for the implementation of actions was not intended entirely for this problem-solving analysis, it was decided to prioritize the actions so that they were carried out in a staggered manner, with the multifunctional group aimed at this problem. As the containment action had already been implemented, this was the managerial strategy to cover all the activities of the multifunctional group.

To rank the actions obtained, the Analytic Hierarchy Process (AHP) with Ratings was used. The hierarchization process was carried out in the light of three evaluation criteria defined by the multidisciplinary group, namely: ‘Quality’, ‘Time’ and ‘Cost’. The meaning of each of these criteria and the importance of their consideration in the analysis performed are detailed in TABLE 1.


Tabela

Descrição gerada automaticamente

TABLE 1. Ratings associated with each criterion and description. Source: Author

After formulating the problem and building and validating the hierarchy, the judgment process begins when decision makers express their preferences through the comparison matrices of criteria and levels of intensity.

In this step, the decision matrix is formed in order to obtain the importance values of the criteria and Ratings. The attribution of these values is based on the Saaty Fundamental Scale (Saaty, 1980). For each decision, the Consistency Ratio (CR) is calculated. The priorities for each category are determined using the peer comparison process of the AHP method.

TABLE 2 presents the decision matrix of the judgments of the criteria defined by the decision maker.

Tabela

Descrição gerada automaticamente

TABLE 2. Matrix for the decision of judgments between the criteria. Source: Author

In order to obtain the numerical values of the Ratings, a comparison matrix was created between the intensity levels of the criteria. Through this matrix, it was found the relative importance between the levels of intensity, calculating the eigenvector that represents the "performance" for each level of intensity.These classifications should be idealized before calculating the final alternative priorities.

All CR (Consistency Ratio) presented below 10% (or 0.1) indicate consistency in the judgments of decision makers. From the vectors generated by the method, local criteria priorities were obtained. TABLE 3 presents a final score for each action. It is calculated by adding the products between the global priorities of the criteria and the values of the classifications for each alternative, thus obtaining the column “Totals” that normalized presents the final score (“Final priorities”). The calculations were performed on an Excel spreadsheet developed for this purpose.


Tabela

Descrição gerada automaticamente

TABLE 3. Classification of alternatives in evaluations. Source: Author.


As expected, actions related to quality took first place in the ranking of shares, as they are those that directly affect the quality of the product in question, as satisfaction is one of the primary values for the company.

3.2.4.5.         Step 7: Action Plan Execution

After the completion of the action plan, the implementation phase of the actions was performed by areas following the ranking.


3.2.4.6.         Step 8: Verification

After the execution of all the planned actions and the documentation of the results, unforeseen events and delays of some actions, the information obtained through the quality indicator of Defect percentage per lot was analyzed. The FIGURE 7 show the defect rate of lots through all phases of the study.

Gráfico, Histograma

Descrição gerada automaticamente

FIGURE 7. Graph of evolution of the relationship between PDCA and Quality Indicator. Source: Author


The planning stage consisted of identifying, observing and analyzing the problem, drawing out containment actions and drawing up a definitive action plan starting in August 2020. The action execution stage then started, where the actions were sequenced and started to be carried out by the multifunctional group. As of September 2020, the positive results were verified and verified.

The target stipulated in the present study consisted of a defect rate below 1.00%. Figure 7 shows that expectations were exceeded, by showing a history of values below 1.00% as of the beginning of November / 2020, this rate being maintained in the coming months, guaranteeing the effectiveness of the work performed.


3.2.4.7.         Step 9: Standardization

It is possible to observe the effectiveness of the actions taken from the previous step, proven through the information collected and the defect rate indicator. Thus, the standardization step consisted of standardizing the new established processes, through procedures for transmitting knowledge to everyone involved in the training process.

All actions taken were documented through procedures or equipment manual so that all learning and knowledge acquired during this work was not lost. It can also contribute to new operators and associates entering the manufacture.


3.2.4.8.         Step 10: Conclusion

In the last step of the proposed MASP method, all documents and information generated during the practice of the method were consolidated and presented to the local management. Figure 7 as already explained, shows all the evolution of the process and the team during the work, the level of defect rate managed to stay below the target of 1.00%. At the conclusion of the work, no planned activities were identified that were not carried out and no new problems arose due to the established standards. Challenges for the organization and for its professional development.


4.     RESULTS

The search for the reduction of losses in the production process is of paramount importance for a company's competitiveness in the market, as it reduces non-quality costs and increases the company's profitability. The present work involved different methods for analyzing and solving problems, such as PFM and AHP associated with the systematic analysis and problem solving, MASP, together with the use of other quality tools. The main objective was to investigate compare, suggest and apply a method composed by the PFM, AHP and MASP methods, comparing them with existing theoretical methods and describing the method to be adopted for the work of reducing losses.

The use of the PFM approach was extremely important to detect the causes of an intangible problem. Through its graphic representations, it was possible to carry out an analysis of the interrelationships between the constructs and the causal relationships present in the problematic situation in a temporal manner, this was extremely important to verify the correlations of the activities already carried out in the process, which affected the subsequent activities. In addition, the maps generated in the PFM incorporate the application of the contrast of each client's statement, making them clear to be explained, minimizing the possibility of double interpretation.

Thus, the PFM proved to be an interactive process of learning about the problematic situation, characterized by constant debates and participation by all involved. The map assembled as a part of real problem identification and cause analysis, allowed participants to come to a common understanding of the problem.

The proposed problem analysis and solution method proved to be effective, with the use of quality tools to support analysis and decision making by the multidisciplinary group. During the phases of the proposed method referring to planning, the uses of quality and PFM tools were fundamental to legitimize the detection of the root causes of the problem to be worked on and eliminated.

In the planning and prioritization of actions, the use of AHP allowed to reduce the subjectivity of the mappings and to improve the degree of reliability for the implementation of corrective actions. In addition, the AHP analyzes and compares more than one criterion, in this work it was observed that the criterion "Quality" was the most relevant. For this problem, the Ratings approach allowed the reduction of the number of comparisons that would be necessary with the use of the traditional approach of this method.

In the execution of the planned actions, all the proposed actions were put into practice following the plan and schedule and presented satisfactory results in the verification phase of the actions, therefore, we can admit that the fundamental causes of the problem were eliminated.

Finishing MASP, the main objective of reducing the defect rate was achieved and reaching the success indicators established by the team: defect rates are around 0.5% below the 1.0% Spec-AQL, as expected for Class I defects. The control of defect rate indicators has become an activity of joint responsibility of the team and management for monitoring and directing future work.

The effectiveness of the actions and the results achieved were valued by the board of directors, in this way, the proposed method was able to fulfill its role by demonstrating its validity in organizational intervention. As a difficulty, we can highlight the little literature still in force on the PFM method, having more academic scope than in the practical sphere, where there are few cases of application.


5.     FINAL CONSIDERATIONS

It is notorious that the analytical structure of the application of the proposed method for the solution of the problem of high quantity of defects in a production process, in all the phases presented. The quality of the product went from a level where no batch would pass the Final Inspection to a level where there is a 95% confidence that all batches would be below Spec-AQL for the defect in question.

It was concluded that the proposed method, uniting the MASP, PFM and AHP methodologies, proved to be effective in reducing the high rate of defects, in addition, we can put three factors, which without a doubt, were of great relevance to provide the result:

a) Training applied to all participants in relation to the proposed methodologies and in relation to corrective actions, covering all shifts and with sufficient workload.

b) The best recommended practice of the problem identification phase, contemplating the use of real data and facts for the identification of the problem. These data came from the verification indicators, Pareto graphs, application of the PFM and cause and effect diagram.

c) The formation of a multidisciplinary team, in which the professionals involved came together with the objective of improving the processes, facilitating the execution of all stages of the proposed method, since they all had a single objective in common, the resolution of the problem in question.

With the result of these 3 items, it was possible in this work period to reduce the defect ration for less than 1% of defects, after closing all the results.

The difficulties regarding the proposed study were:

1)    Long period of the study, especially in the planning phase when analyzing it from the perspective of the PDCA.

2)    Knowledge in the methodology, it was the first structured work conducted in the new manufacturing area, where the processes and equipment are new for everyone on the team, from operators, engineers, facilitators and even managers.

3)    Lack of resources: it was necessary to restructure the entire project area, so that the people who worked directly on the project, helped in the production of the new products. The project could not stop and the production of new products for the market was also extremely important for the organization.

As of the end of the study, the data were standardized and consolidated. It was concluded that the application of the proposed method, applied in its stages, showed effectiveness to reduce the high rate of defects in the process, due to the structuring of how the application of the method of analysis and problem solving was conducted.

For future work, it is suggested to carry out the proposed method for other problems. complex to prove the spread of application of the proposed method. Some specific themes can also be explored further, such as the role of leadership in transform learning opportunities from specific mistakes or failures (and in their consequence) and the role of diversity in learning from mistakes and behaviors team innovators.


6.     ACKNOWLEDGEMENT

This study was financed in part by the Coordenação de Aperfeiçoamento de Pessoal de Nível Superior – Brasil (CAPES)


7.     REFERENCES

Aguiar, P. C. G. (2004). Aplicação da metodologia de análise e solução de problemas na célula lateral de uma linha de produção automotiva. 2004. 65f. Trabalho de Conclusão de Curso (Especialização em Gestão Industrial) – Departamento Economia, Contabilidade e Administração, Universidade de Taubaté, Taubaté.

Campagnaro, C.A. (2007). Proposição de uma estrutura referencial para tratamento de não conformidades em componentes produtivos do setor automotivo. 2007, 188p. Dissertação (Mestrado em Engenharia de Produção e Sistemas) – Pontifícia Universidade Católica do Paraná, Curitiba.

Campos, V. F. (2004). TQC: controle da qualidade total (no estilo japonês). 8. ed. Nova Lima, MG: Editora FALCONI.

Cardoso Júnior, J. T. (2019). Estruturação do Contexto Problemático do RWR na FAB. São José dos Campos: Instituto Tecnológico de Aeronáutica. Trabalho de Conclusão de Curso de Especialização em Análise Operacional.

Castro, A. D. J, Pinheiro, A, Yovanka Pérez Ginoris, Y. P. (2001). Aplicação do Método de Soluções de Problemas em um sistema de tratamento de efluentes de indústria frigorífica de aves. Revista Ambiente & Água - An Interdisciplinary Journal of Applied Science, v.6, n.3.

Eden, C. (1992). Analyzing cognitive maps to help structure issues or problems. European Journal of Operational Research, v. 159, p. 673-686, 2004.

Eden, C.; Ackermann, F.; Cropper, S. The analysis of cause maps. Journal of Management Studies, v. 29, p. 309-324.

Henriques, L. M. (2013). Aplicação do MASP no desenvolvimento de programas de prevenção de acidentes ferroviários. 2013. 80f. Monografia (Graduação em Engenharia de Produção) – Universidade Federal de Juiz de Fora, Juiz de Fora.

Georgiou, I. (2011). Cognitive mapping and strategic options development and analysis (SODA). In: Wiley Encyclopedia of Operations Research and Management Science. John Wiley.

Mingers, J.; Rosenhead, J. (2004). Problem structuring methods in action. European Journal of Operational Research, v. 152, n. 3, p. 530-554.

Hagemeyer, C.; Gershenson, J. K.; Johnson, D. M. (2006). Classification and application of problem-solving quality tools. a manufacturing case. The TQM Magazine, v. 18, n. 5, p. 455-483.

Saaty, T. L. (2008). Decision making with the analytic hierarchy process. International Journal of Services Sciences, v. 1, n. 1, p. 83-98.

Salgado, E. G. et al. (2009). Análise da aplicação do mapeamento do fluxo de valor na identificação de desperdícios do processo de desenvolvimento de produtos. Gestão e Produção, v. 16, n. 3, p 1-13, jul./set 2009.

Severo, M. R. F.; Melo, M. A. N. Medeiros, D. D. (2004). Importância estratégica de sistema de qualidade para aumentar a competitividade empresarial: aplicação em uma empresa de calçados esportivos. In: Encontro Nacional De Engenharia De Produção. Florianópolis. Anais [...]. Florianópolis: ABEPRO, 2004, p.24.

Silva, C. S. A., Belderrain, M. C. N; Pantoja, F. C. M (2010). Prioritization of R&D projects in the aerospace sector: AHP method with ratings. Journal of Aerospace Technology and Management. v. 2, n. 3, p. 339-348, Sep-Dec.

Yang, D.; Rhee, M. (2017). The role of co-production networks in organisations efforts to enhance the learning curve outcomes. Total Quality Management and Business Excellence, v. 28, n. 12, p. 1421-1445.