10.31047/1668.298x.v41.n1.41276
Artículos
Assessment of land use change in the dryland agricultural región of Córdoba, Argentina, between 2000 and 2020 based on NDVI data
Evaluación del cambio en el uso del suelo en la región agrícola de secano de Córdoba, Argentina entre 2000 y 2020 basado en datos NDVI.
A De la Casa 1
G Ovando 1
G Díaz 1
P Díaz 1
F Soler 1
J Clemente 1
1 De la Casa, A. (ORCID: 0000-0003-4317-6797), Ovando, G. (ORCID: 0000-0002-6015-404X), Díaz, G. (ORCID: 0000-0002-3714-4652), Díaz, P (ORCID: 0000-0003-0201-349X), Soler, F (0000-0001-74313665), Clemente, J. (ORCID: 0000-0001-9318-8089): Universidad Nacional de Córdoba, Facultad de Ciencias Agropecuarias. Córdoba, Argentina. Correspondence to: delacasa@agro.unc.edu.ar
ABSTRACT
The dryland reglon of Córdoba provlnce experlenced a strong ¡ncrease ¡n agricultural land-use ¡n the 21st century. Between years 2000 and 2020 the temporal varlatlon of land-use measures derlved from the seasonal varlatlon curve of the Normallzed Dlfference Vegetatlon Index (NDVI) was analyzed. In eleven departments of the reglon, the followlng NDVI measurements were obtalned for each crop cycle from September to Aprll: mlnlmum value (NDVIn), maxlmum value (NDVIx), amplltude (NDVIa=NDVIx-NDVIn) and mean value (NDVIm). The sowlng percentage per department was analyzed spatlally and temporally, as well as the land use lndlcators. Both NDVIn and NDVIx are related to the sowlng area per department, determlnlng a negatlve correlatlon (-0.36) for NDVIn and a posltlve one (0.596) for NDVIx. The posltlve correlatlon wlth NDVIa (0.569) ls consldered dlrectly llnked to the agrlcultural land use. The seasonal varlatlon of the NDVI showed changes over tlme, whlch were compatlble wlth the lncrease ln agrlcultural actlvlty ln the reglon. Although the lncrease ln agrlcultural land use was notlceable through both the decrease ln NDVIn and the lncrease ln NDVIx, along wlth a general trend towards rlslng NDVIa values, the varlatlon was more apparent ln those departments where agrlcultural actlvlty lncreased to a greater proportlon.
Keywords: soybean, corn, temporal trend, sustalnablllty.
RESUMEN
La reglón de secano de la provincia de Córdoba experimentó un fuerte aumento en el uso agrícola del suelo en el siglo XXI. Se analizó la variación entre los años 2000 y 2020 de diferentes medidas relacionadas al uso del suelo derivadas de la curva de variación estacional del Indice de Vegetación de la Diferencia Normalizada (IVDN). En once departamentos de la región se obtuvieron las siguientes mediciones del NDVI de septiembre a abril: mínimo (IVDNn), máximo (IVDNx), amplitud (IVDNa=IVDNx-IVDNn) y valor medio (IVDNm). Se estableció espacial y temporalmente el porcentaje departamental de siembra y del conjunto de indicadores de uso del suelo. Tanto IVDNn como IVDNx están relacionados con la superficie departamental de siembra, determinando una correlación negativa (-0,36) para IVDNn y positiva (0,596) para IVDNx. La correlación positiva con IVDNa (0,569) se considera ligada de manera directa al uso agrícola del suelo. La variación del IVDN muestra cambios a través del tiempo, compatibles con el aumento de la actividad agrícola en la región, que se evidencia tanto por la disminución del IVDNn, el aumento del IVDNx y una tendencia positiva de IVDNa, más evidente en aquellos departamentos donde la actividad agrícola incrementó el uso del suelo en mayor proporción.
Palabras clave: soja, maíz, tendencia temporal, sustentabilidad.
INTRODUCTION
In the central region of Argentina rainfall amounts fluctuated notably throughout the 20th century, with negative rainfall anomalies until the 1960s that became positive thereafter (De la Casa, Ovando and Díaz, 2018). The combined effect of deforestation, overgrazing, as well as inappropriate tillage technologies, under extremely dry and windy weather conditions, produced severe dust storms during the 1930s and 1940s, that caused livestock mortality, crop failure, economic bankruptcy of productive systems and migration of the rural population. The increased rainfall during the second half of the last century, on the other hand, led to the conversion of abandoned farmlands into grazing or cultivated land (Viglizzo and Frank, 2006).
The decrease in water deficiency during the second half of the 20th century increased the productive potential of the dryland agricultural region of Córdoba (Magrin et al., 2005; De la Casa and Ovando, 2014). This change towards a more favorable climatic condition is explained by the sustained increase in the rainfall regime (Sierra et al., 1994; Viglizzo et al., 1995; Liebmann et al., 2004; González et al., 2013; De la Casa, Ovando and Díaz, 2018), rather than by an alteration in the atmospheric demand for water (De la Casa and Ovando, 2016). Long-term climatic variation, together with the development of more adapted technologies to sub-humid and semi-arid environments, such as no-tillage farming, had a great impact on agricultural activity, such that agricultural production increased steadily since the 1960s in detriment of livestock, which had been the predominant activity during the 20th century (Viglizzo and Frank, 2006).
The positive phase of the rainfall regime is explained, in some cases, as the result of a climatic jump that, associated with the phenomenon of global warming, would have permanent consequences (Minetti and Vargas, 1997). Alternatively, an even greater concern arises from a pendular (Suriano and Ferpozzi, 1993) or oscillating conception of rainfall (De la Casa and Nasello, 2010; De la Casa, Ovando and Díaz, 2018), since a negative phase of the rain cycle should follow the current positive phase. According to the agroecological history of the region, the substitution of livestock production by agriculture can be detrimental both in environmental and economic terms, thus a permanent monitoring and evaluation of land-use is justified.
Viglizzo et al. (2001) used a set of indicators to assess the sustainability of agricultural production systems. Land-use and the application of technology are the major determinants of rural environment sustainability, since they ¡nfluence the functionality of agroecosystems. Among different indicators proposed, ¡n the first place Viglizzo et al. (2003) employed land-use due to its great agroecological relevance, consequently, it is necessary to develop procedures that carry out permanent monitoring of land-use and evaluate their changes over time. In addition to the conventional information from surveys and censuses, it is currently feasible to monitor land-use from radiometric data, a procedure that requires a prior reliable interpretation of the satellite signal (Fox et al., 2017). Procedures that apply radiometric data have been gaining ground as satellite information is not only increasingly available at different scales of spatial detail, but also because the series are more extended over time and allow temporal inspection of data (Guida-Johnson and Zulueta, 2013).
The spectral vegetation indices (VI), such as the Normalized Difference Vegetation Index (NDVI), Enhanced Vegetation Index (EVI), Soil Adjusted Vegetation Index (SAVI), or Wide Dynamic Range Vegetation Index (WDRVI), set up simple expressions useful to monitor the crops condition and productivity (Becker-Reshef et al., 2010; Sakamoto et al., 2014; Saeed et al., 2017; Seo et al., 2019; Liu et al., 2020; Nolasco et al., 2021). Likewise, the temporal dynamics of VI also allows us to identify phenological changes that the vegetation experiences over time (Zhang et al., 2003). Different time series analysis procedures, HANTS (Verhoef, W., 1996), TIMESAT (Jonsson and Eklundh, 2004; Udelhoven, 2011), among others, have been developed using spectral indicators as a proxy for vegetation, in order to identify most characteristic moments of the evolution and seasonal changes of the vegetation. Jayawardhanaa and Chathurangeb (2016) extracted parameters from NDVI-MODIS time series to characterize the different agroecological zones of Sri Lanka, and Brown et al. (2010) analyzed the phenological dynamics of the vegetation in Africa in response to the most preponderant climatic oscillations in the region.
More specifically, Sakamoto et al. (2010) proposed a procedure to detect the succession of phenological stages in corn and soybean from the analysis of WDRVI data from the MODIS instrument. On the other hand, Seo et al. (2019) referred to the parameters of the beginning, end and peak of the season to represent the phenology of corn and soybean crops. The peak of greenness or maximum value of the NDVI curve is one of the indicators that these algorithms use to represent the productive potential of the vegetation (Skakun et al., 2019; Stepanov et al., 2020). Also, its occurrence constitutes a phenological reference that, associated with the reproductive stages of flowering, tasseling or silking in maize and pod establishment in soybean, constitutes a critical period for crops due to their high sensitivity to lack of water (Sakamoto, 2020; Wan et al., 2021).
Viglizzo et al. (2003) do not find a conclusive answer about the sustainability conditions of agricultural systems in the Pampean region and their productive trajectories over time. However, they propose developing a long-term monitoring system of the rural environment based on reliable indicators that serves as a tool to guide environmental policies, promote research priorities and guide communication strategies. In order to implement Viglizzo's approach (2003) and for the regional-scale analysis proposed by this study, the work hypothesis holds that the NDVI seasonal variation curve constitutes not only an appropriate indicator to evaluate the crops productivity, but also to recognize land-use changes that have occurred in the agricultural dry region of Córdoba over time.
In an attempt to assess the dynamics of land-use in the rain-fed region in the province of Córdoba, the objective of the work was to analyze, in each department, the temporal variation between 2000 and 2020 of different indexes related to land-use derived from the NDVI seasonal variation curve. This paper proposes the evaluation of indicators that reveal the predominant land-use modality in a transitional territory comprising humid environments, traditionally used as agricultural areas, and regions characterized by increasing aridity and originally used as livestock farms, in an effort to produce basic information about the sustainability conditions of agricultural systems.
MATERIALS AND METHODS
1. Data
In the central region of Argentina, the climate of the province of Córdoba is characterized by a double thermal and hydric transition (De la Casa and Ovando, 2014). While the warm temperate regime in the north of the territory becomes slightly colder towards the south, the availability of water follows a decreasing gradient from east to west (Rodríguez and De la Casa, 1990). Although crop requirements for energy and temperature are usually satisfied during the summer season, the insufficient or untimely water supply is the main factor that limits productive capacity and generates yield gaps in the region (Aramburu Merlos et al., 2015), for both corn (De la Casa et al., 2019) and soybean (De la Casa et al., 2018). The study area includes the eleven departments located in the southeast of the province of Córdoba (Figure 1). These departments currently harvest more than 80 % of the provincial production of soybean and corn. Plot sizes exceeding 50 ha of surface cover more than 90 % of the agricultural area in this region (Ghida Daza and Sánchez, 2009).
The soils in this region are classified as entic and typic Haplustolls, and they present a slightly undulating fíat relief developed on loessic material, of silt loam texture with a small slope to the east. The climate in the study area is classified as dry sub-humid (Rodríguez and De la Casa, 1990), and the average annual rainfall is approximately 800 mm, concentrated in summer, and shows a decreasing gradient from east to west (Rolla et al., 2018). In this area, agricultural production is mainly rain-fed (Figure 1) and the two predominant summer crops are soybeans and corn (Sayago et al., 2017).
The Ministry of Agriculture, Livestock and Fishery of Argentina (Ministerio de Agricultura, Ganadería y Pesca, MAGyP) provided corn and soybean sowing area data for the eleven most productive rain-fed agricultural departments in Córdoba province (MAGyP, 2021). The information corresponds to the planting area of soybean and corn crops reported each year, which was expressed with respect to the extension of the respective department. Both fractions were accumulated in order to represent the agricultural land area. In order to show the sowing area progress, Figure 2 presents the sowing fraction in the departments of Marcos Juárez and General Roca between 2000 and 2020.
Monthly Normalized Difference Vegetation Index data (MOD13C2) derived from the MODIS sensor on board of the TERRA satellite was used in this study. The MOD13C2 Version 6 product provides a Normalized Difference Vegetation Index (NDVI) value at a per pixel basis in a 0.05-degree latitude/ longitude Climate Modeling Grid (CMG). A CMG granule is a geographic grid with 7,200 columns and 3,600 rows representing the entire globe. More details on MODIS NDVI products can be found in Huete et al. (2002).
According to the availability of both crop information and remote sensing data, twenty-one summer crop seasons from September to April of the following year were used (from 2000/2001 to 2020/2021). This product was obtained from the Application for Extracting and Exploring Analysis Ready Samples (AppEEARS) online data system, developed and maintained by NASA GES DISC (Acker and Leptoukh, 2007).
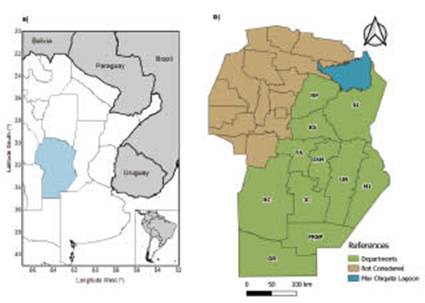
Figure 1: a) Location of study area, Córdoba province, Argentina and Argentina location in South America. b) Administrative areas (departments) in Córdoba province. In green departments of rainfed region employed in regional differences analysis. Departments: General Roca (GR), General San Martín (GSM), Juárez Celman (JC), Marcos Juárez (MJ), Presidente Roque Sáenz Peña (PRSP), Río Cuarto (RC), Río Primero (RP), Río Segundo (RS), San Justo (SJ), Tercero Arriba (TA) y Unión (UN).
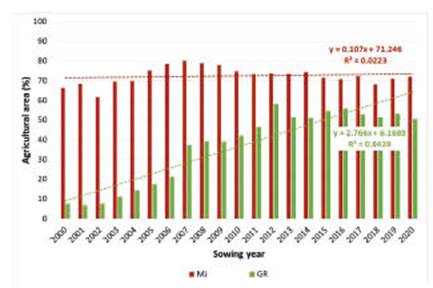
Figure 2: Agricultural area (%) in Marcos Juárez (MJ) and General Roca (GR) departments, between 2000 and 2020.
2. Methods
Based on the NDVI seasonal variation curve, which considers the potential cultivation period between the months of September and April for each year, as shown in Figure 3. The indicators used for assessing land-use change were:
• The minimum value of NDVI (NDVIn): this meas-ure is associated with the sowing operation, fol-lowed by crop emergence. The beginning of the phenological curve growth is associated with the “green-up” (first detectable moment of green-ness of seasonal plants), which for soybeans is the emergence of crop (Diao, 2020);
• The NDVI maximum value (NDVIx): it is associated with the crop potential productivity (Liu et al., 2020);
• The seasonal amplitude NDVI value (NDVIa = NDVIx-NDVIn): it serves to differentiate areas dedicated to livestock where pastures and natural vegetation predominate (platykurtic type curves), with respect to the surface with agricultura! use (leptokurtic curves) (Wardlow and Eg-bert, 2008);
• The mean value of NDVI (NDVIm): it was calcu-lated to express the potential cropping period.
An analysis of the trend of agricultural area and NDVI indicators was conducted. The percentage of sowing in each department, as well as the set of land-use indicators, were analyzed both spatially and temporally. Initially, sectors where changes in land-use were most noticeable were assessed. Subsequently, temporal variations were evaluated based on the change trend over time (2000 to 2020). The linear relationship of each indicator was utilized to determine the slope (positive or negative) as an expression of the temporal change that occurred and its statistical significance. This approach allowed to identify the departments that truly demonstrated effective change.
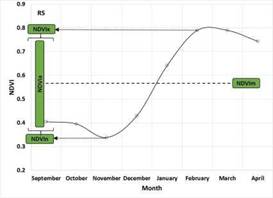
Figure 3: Indicators used to assess land-use changes derived from the NDVI seasonal variation curve. Maximum (NDVIx), minimum (NDVIn), amplitude (NDVIa) and mean (NDVIm) NDVI values.
RESULTS AND DISCUSSION
1. Expansión of agricultural activity in the región between 2000 and 2020
The information from the 2018 National Agricultural Census (Censo Nacional Agropecuario, CNA-18, 2018), with respect to 2002 (CNA-02, 2002) indicates that livestock production in Argentina experienced a marked decline from 2002 to 2018. The number of farms dedicated to cattle ranching decreased from 193,886 in 2002 to 130,803 in 2018, representing a reduction of approximately one third (-32.5 %). Likewise, while in the 2002 census the number of bovine cattle was 48,539,411, in 2018 the cattle population amounted to 40,411,905, which represented a 17 % decrease in cattle stock. Although in the Pampas region, which has 71 % of Argentinian livestock, the reduction was 21 %, the decrease in the province of Córdoba was even more pronounced and reached 41 %.
This information reveals that agricultural activity in the dryland region of Córdoba underwent a profound change during the first decades of the 21 st century, and that many lands dedicated to cattle ranching migrated over time to agricultural production (Paruelo et al., 2005). The progressive incorporation of agricultural activity in areas originally ranching is evidenced in Figure 4, which shows the increase experienced by the agricultural area with summer crops in each department in the region (only the area occupied with soybeans and corn is considered). Data are presented as four-year averages to reduce the influence of different short-term contingencies (prices, markets, etc.) on sowing decisions.
Figure 4 also indicates that the agricultural area in all sectors corresponds to a smaller departmental fraction at the beginning of the analyzed period (2000-2003), with the agricultural area notably increasing over time. Assuming that the slope of the linear relationship between the sowing area and time represents the rate of agricultural land-use incorporation of each territory, Table 1 shows the trend only in Marcos Juárez (MJ) is not significant, although positive as in the rest of the departments.
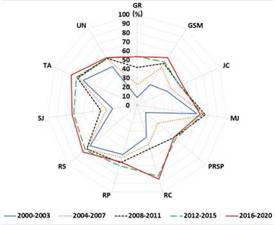
Figure 4: Average cultivated area of corn or soybeans (%) (agricultural land) in major rain-fed agricultural departments of Córdoba province, Argentina, during 2000-2003, 2004-2007, 2008-2011, 2012-2015 and 2016-2020 periods.
It is also noteworthy that the increase in the planting area was not uniform across all the region. The difference between the planting fraction in each department in the last period analyzed (20162020) and the initial period reached maximum values in the departments of Río Cuarto (RC) (48 %), General Roca (GR) (45 %), San Justo (SJ) (45 %) and Presidente Roque Sáenz Peña (PRSP) (41 %), while it presented minimum values in MJ (4 %); Río Primero (RP) (8 %), Río Segundo (RS) (10 %) and Unión (UN) (12 %), with a particularly notable increase from the period 2008-2011. In this way, it is interpreted that the adoption of agricultural activity originated in the center and SE of the region, where agricultural activity was already established at the beginning of the 21st century, and spread towards the S, SW and N where there was a more prevalent livestock use in the productive systems.
Figure 2 shows two contrasting situations in the change of agricultural land use over the analyzed period (2000-2020); the selected departments were MJ and GR. The agricultural area of MJ remained around 70 % between 2000 and 2020, while GR experienced a significant increase, rising from 10 % at the beginning to 50 % from 2012 to 2020.
The summer production in the region encompasses not only soybean and corn crops but also other species such as peanuts, sorghum, and sunflower, which are regular parts of the rotation. Despite this diversity, the agricultural area dedicated to the study crops during the period 2016-2020 consistently remained above 50 % in all departments, with some areas even reaching 80 % of the total territory.
Therefore, it can be deduced that the seasonal curves of NDVI correspond to and currently represent a predominant agricultural use in the territory of Córdoba. On the other hand, the expansion of agriculture in Córdoba found support, among various technical, economic and commercial factors, due to the fact the climatic conditions were favorable for rain-fed agricultural practice, sustained by a more humid regime at least until 2010 (De la Casa and Ovando, 2014).
2.1 NDVI seasonal variation
Figure 5 presents the NDVI data from September to April, corresponding to the potential growing season of corn and soybeans in the various departments of the region. It also displays the monthly average values for four-year periods, alongside the average value of the complete period (2000-2020), to represent the orderly temporal succession of NDVI in each sector.
The seasonal variation of NDVI in the region presents a unimodal behavior, with minimum values in winter-spring and maximum values in the summer period. Chang et al. (2007) show that the seasonal variation of the NDVI of corn or soybean presents a more abrupt peak (leptokurtic type curve) when the cultivation area is greater than 50 % of the territory and they use the phenological information to discriminate between different environments and agricultural management. This temporal pattern is eventually modified when the production system incorporates double cropping, with a wheat-soybean or wheat-corn sequence, in such a way that the NDVI curve presents two relative maximums (Wardlow and Egbert, 2008). While the first spring maximum in Córdoba is barely perceptible because the wheat area is scarce in the region (De la Casa and Ovando, 2007), the second summer-autumn maximum is more pronounced and the only one the curves show for the spatial resolution of the images used in this work.
The greater agricultural potential during summer is explained in climatic terms because the rains occur mainly (nearly 80 % of the annual value) during the warm semester (De la Casa, Ovando and Díaz, 2019), so that both water and energy are available resources that contribute to crop growth. The water and heat conjunction is propitious for the rain-fed agricultural production of Córdoba during the warm semester and it also strengthens the dominant role of corn and soybean crops, to the extent that the frequency of extreme yield gaps is relatively low for both crops (De la Casa et al., 2018; De la Casa et al., 2019).
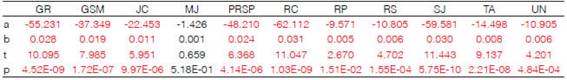
Table 1: Regression coefficients (a: intercept; b: slope) of the linear relationship between the departmental fraction planted (agricultural area) and time (years), t value of the slope and its probability (p) for each department in the dryland region of Córdoba, Argentina. The p values <0.05 are significant (in red). Departments: General Roca (GR), General San Martín (GSM), Juárez Celman (JC), Marcos Juárez (MJ), Presidente Roque Sáenz Peña (PRSP), Río Cuarto (RC), Río Primero (RP), Río Segundo (RS), San Justo (SJ), Tercero Arriba (TA) y Unión (UN).
Some particular features of the temporal dynamics of the NDVI curve are detected in Figure 5. From the minimum values (NDVIn) in winter-spring, associated with the sowing time of the summer crops, the NDVI later on exhibits a vigorous increase that expresses the exponential growth of the crops during the vegetative stage, until reaching a maximum value (NDVIx) during the summer. Finally, the NDVI tends to decrease towards the beginning of autumn, when the crops undergo senescence through the final stages of the cycle until their complete physiological maturity and eventually harvest (Seo et al., 2019).
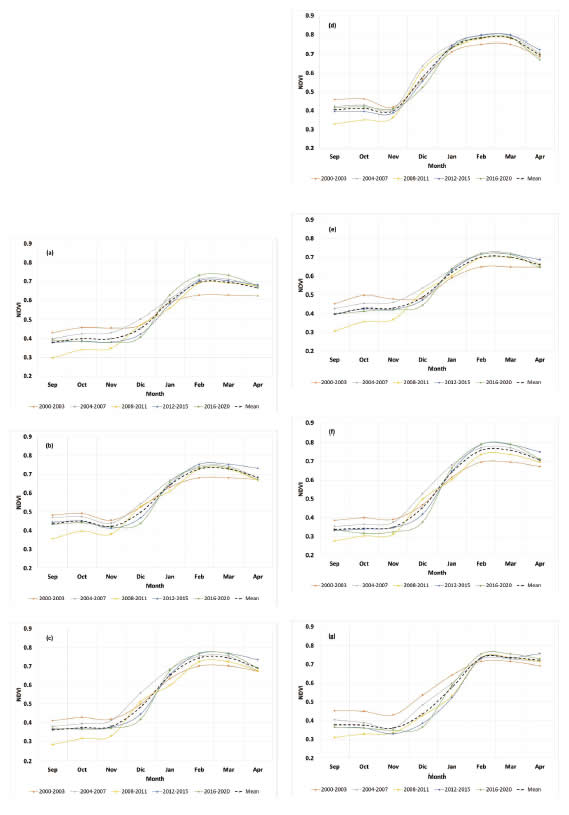
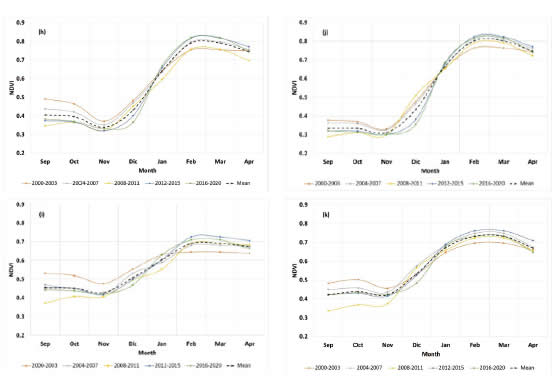
Figure 5: NDVI variation during the summer growing season in the different departments (a): GR; (b): GSM; (c): JC; (d) MJ; (e): PRSP (f): RC; (g): RP; (h): RS; (i): RJ; (j): TA and (k): UN of the dryland agricultura! region of Córdoba province, Argentina. In addition to the general mean value, those corresponding to 2000-2003, 2004-2007, 2008-2011,2012-2015 and 2016-2020 periods are presented.
In addition to this generalized seasonal fluctuation in the region, a common temporal pattern is also observed. Taking into account the general average value of each department as a reference, an interesting trend emerges: during the initial 4-year period, NDVI values at the time of planting consistently exceeded the average, while the maximum (peak greenness) values during this period consistently fell below. Conversely, this pattern has reversed in the most recent periods, with minimum values consistently recorded below the long-term average and maximum values surpassing it (Figure 5).
This behavior denotes an increase in amplitude (NDVIa) as time elapses from the first cycles to the present. In this sense, an increase in the amplitude of the seasonal variation curve of the NDVI is interpreted as associated with a progressive adoption of agricultural activity, particularly in those departments that at the beginning of the 21st century predominantly had livestock use.
2.2 NDVI trend assessment
The aspects described about Figure 5 were analyzed objectively, considering the trend experienced by the NDVI monthly values in each sector over the 21-year period. This information is presented graphically in Figure 6, which shows in particular the information from GR and MJ, while in Table 2 the evaluation extends to the entire region.
In correspondence with Figure 2, it can be seen that the change in NDVI over time has been more generalized in GR, since in four of the eight months the time trend is significant. On the other hand, while in October, November and December the slopes are negative, the condition is reversed in February. Only December shows a significant NDVI decrease in MJ, while the changes (increase or decrease) for the rest of the months are barely perceptible and accidental.
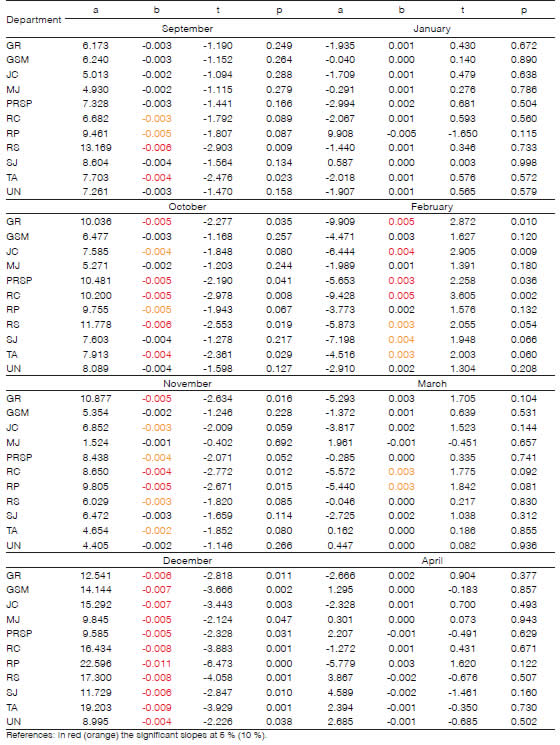
From Table 2, the NDVI value between September and December shows a tendency to decrease in the twenty-one years analyzed. The rates are negative in all the departments considered and reach a significant condition (p <0.05) mainly in November and December. On the contrary, between January and April the NDVI values tend to increase, at least in those cases where the trend is significant. While NDVI values between September and December in the first years of the analysis are higher than the most recent ones, February and March show the opposite behavior, with values that are currently higher.
 Table
2:
Interception (a), slope (b), t value and probability (p) of the linear
relationship (trend) between the NDVI monthly valúes (dependent variable) and
time (years between 2000 and 2020) in the departments of the dryland
agricultural region of Córdoba, Argentina.
Table
2:
Interception (a), slope (b), t value and probability (p) of the linear
relationship (trend) between the NDVI monthly valúes (dependent variable) and
time (years between 2000 and 2020) in the departments of the dryland
agricultural region of Córdoba, Argentina.
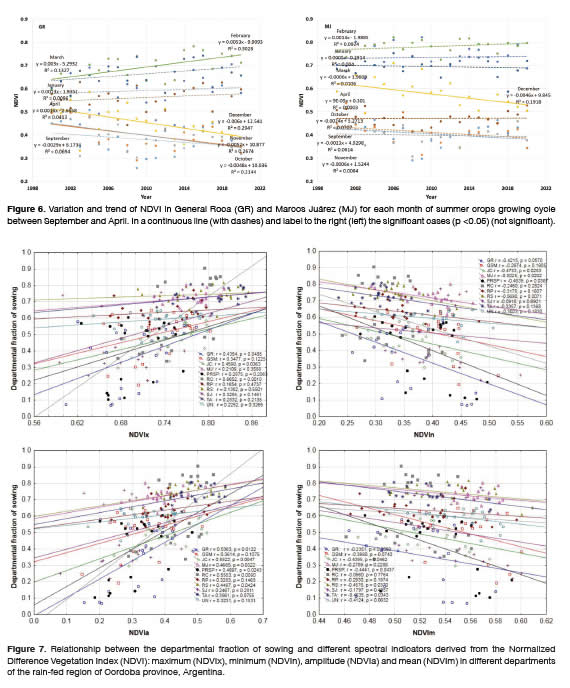
The decreasing rate of NDVI recorded in the region during the first half of the crop growing season is interpreted by a gradual change in soil use which in the first years presented a more widespread cattle practice and a greater proportion of land occupied with pastures -especially in the western and southern sectors- but later gradually shifted to agricultural practices. While the changes in the departments of MJ, UN and GSM are less evident, since only in December the negative trend is significant, in the rest of the departments they are more pronounced and expose the increase in agricultural land-use in the region. This would also explain the NDVI increase during February and March with respect to the values at the beginning of the series, giving rise to a seasonal curve whose amplitude is more pronounced, which is typical of land-use where agricultural activity predominates (De la Casa and Ovando, 2007; Wardlow and Egbert, 2008). In addition to the more extended agricultural use, the tendency of the NDVI to decrease in December is also explained by the fact that delaying the sowing date of summer crops is beginning to be adopted as a common practice in the region (De la Casa et al., 2019).
3. Spectral indicators of land-useIn order to evaluate land-use change, mainly associated with the increase in agricultural activity, the linear relationship between the planting area of summer crops and different spectral indicators derived from the NDVI signal was established. Agricultural use is associated with the sown area in the departments and only considers soybean and corn crops, which are widely spread in the region. Since there are also other summer planting crops, the magnitude of the fraction is considered to represent a base value. Figure 7 shows the information obtained for each department of the rain-fed region of Córdoba.
For the entire region as a whole, the linear relationships of the annual sown area with respect to NDVIx, NDVIn and NDVIa show correlation coefficients of 0.596, -0.360 and 0.559, respectively. Although moderate, all coefficients are significant (p<0.001), which evidences the increase in planting area. Consequently, the land-use for agricultural activity is linked both directly with respect to the maximum value as inversely to the minimum of the NDVI seasonal curve. As both expressions in conjunction determine the amplitude of the NDVI seasonal curve, which is positively related also to the sown area, the increase in NDVIa is concurrent with the increase in the planting area and agricultural land-use. This relationship with respect to NDVIa also reaches significance (p<0.05) in six (GR, Juárez Celman (JC), MJ, PRSP, RC and RS) of the eleven departments that make up the region under study. Beyond the intensity of the signal, the slopes of the relationships also allow us to recognize that while the soybean and corn sowing area in some departments shows a relatively minor change throughout the period studied, in other sectors the increase has been particularly noticeable. On the other hand, the observed dispersion is justified to the extent that the planting decision is prior to the development that the seasonal NDVI curves actually reach, subject to particular climatic conditions during the cycle, which influence both NDVIx, NDVIn and NDVIa values.
Furthermore, Figure 7 shows inverse relationships between NDVIm and agricultural areas in all sectors. Although the correlation is not significant for the complete data set (-0.092; p=0.16), linear relationships are significant (p<0.05) in the departments of JC, PRSP, RS, and TA. As a preliminary explanation, it can be interpreted that the larger agricultural area would be associated with a slight decrease in the mean NDVI value, probably because agricultural systems have a lower capacity to fix carbón compared to livestock systems.
Kumar Oad et al. (2020) used Land Surface Temperature (LST) records instead of NDVI, to analyze changes in rice planting and harvest dates. They determined a significant linear relationship between rice production area and LST, and pointed out that higher vegetative growth in the region is associated with lower LST values. In the same sense and according to the negative correlation that exists between LST and NDVI (Sun and Kafatos, 2007; Johnson, 2014; Ullah et al., 2020), the results obtained from the NDVI can be considered indicative of the agricultural land-use in the dryland region of Córdoba.
4. Temporal variation (trend) of land-use indicators
Once the relationships between NDVIx, NDVIn, NDVIa and NDVIm with the planted area were evidenced, the temporal change of these spectral indicators related in a broad sense to both practice and agricultural use is analyzed below.
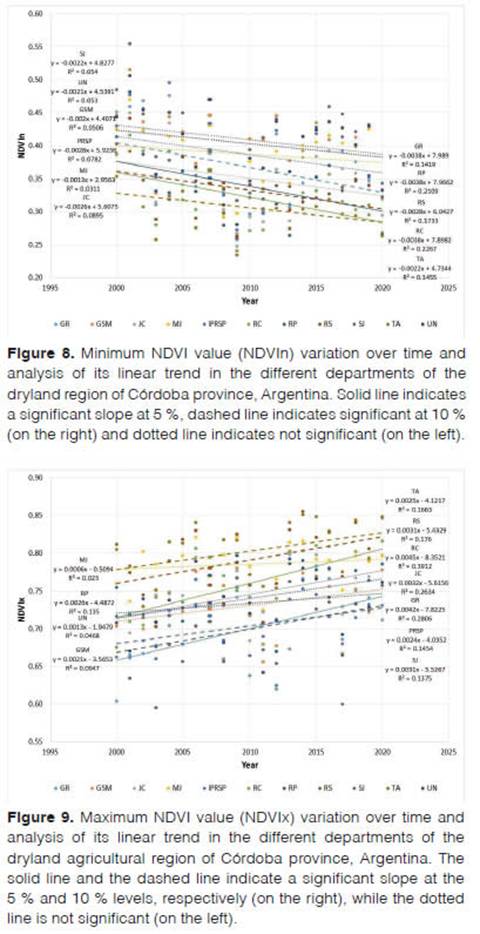
4.1 Trend of NDVI mínimum values
The NDVIn variation over time is presented in Figure 8. Throughout the region, NDVIn shows a systematic decrease, although the trend only reaches a significant character (p<0.05) in the departments of RC and RP and, with less certainty (p<0.10), also in GR, RS and Tercero Arriba (TA). Until 2009, when an episode of La Niña accompanied the considerable decrease in rainfall events in the region (De la Casa, Ovando and Díaz, 2019), the decrease in NDVIn is ostensible but, subsequently, a more stable value is evident. Without discarding the long-term change NDVIn presents between 2000 to 2020, the periodic behavior of the series is also recognized. This variation is in correspondence to the fluctuating nature of rainfall in the region, with cycles of ten and twenty years of duration (De la Casa and Nasello, 2010) and a breaking point around 2009, so that the decreasing rate until then acquires a positive trend.
4.2 Trend of NDVI máximum values
The change over time of NDVIx is shown in Figure 9. Throughout the region, NDVIx shows a systematic upward trend, with rates of a significant nature (p<0.05) in the departments of GR, JC and RC and, with less certainty (p<0.10), also in PRSP, RS, SJ and TA.
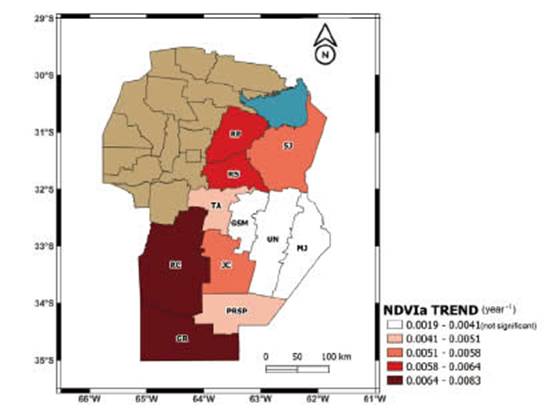
Figure 10: Temporal trend of NDVI amplitude (NDVIa) from 2000 to 2020 in the departments of the dryland agricultural region of Córdoba, Argentina. Departments: General Roca (GR), General San Martín (GSM), Juárez Celman (JC), Marcos Juárez (MJ), Presidente Roque Sáenz Peña (PRSP), Río Cuarto (RC), Río Primero (RP), Río Segundo (RS), San Justo (SJ), Tercero Arriba (TA) y Unión (UN).
While dryland agriculture in Córdoba in the core zone (MJ, UN, GSM) does not present a relevant change in NDVIx over time, the peripheral region where agricultural activity has expanded presents a significant growth peak increase. In addition to the gradual increase in agricultural land-use, the positive trend of NDVIx reveals, based on its positive relationship with crop productivity (Becker-Reshef et al., 2010; Bolton and Friedl, 2013; Liu et al., 2020), that the increase in agricultural area in marginal territories, beyond accidental fluctuations, found favorable conditions.
4.3 Trend of NDVI amplitude values
The decrease in NDVIn and the increase in NDVIx together imply an increase in the amplitude (NDVIa) of the seasonal variation of the NDVI curve, a typical condition of a productive system where agriculture constitutes the predominant activity in the territory. An objective evaluation of the NDVIa variation from 2000 to 2020 was made from the trend analysis, as shown in Figure 10. Unlike Figures 8 and 9, the map in Figure 10 presents the information on the trend of NDVIa values in a territorial way, to highlight those departments where the changes are significant and recognize the sectors that do not reach this condition.
The NDVI amplitude trend is increasing throughout the region, as shown in Figure 10, and only in MJ, UN and GSM the linear slope is not significant, highlighting thatthe change is less evident in the core zone, where agriculture was already established in 2000. On the other hand, in the rest of the departments of the dryland agricultural territory of Córdoba the increase rate of NDVIa is significant (p<0.05). Although with a slightly lower level of security in PRSP (p<0.10) and in SJ (p<0.107), this situation shows the agricultural land-use intensification is located particularly in those marginal areas. Although agricultural land-use increase is present throughout the region, to the extent that the NDVI seasonal variation curves show a greater difference between NDVIx and NDVIn, the change is less noticeable in those traditional agricultural sectors of the southeast and center. Instead, in the southern and western areas of the region, where the greatest incorporation of soils for agricultural activity occurred in the last twenty years, this signal is more noticeable.
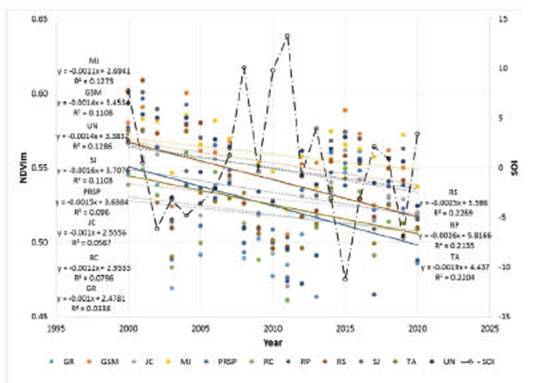
Figure 11: NDVI mean value (NDVIm) from 2000 to 2020 and the linear trend in the departments of the dryland agricultural region of Córdoba, Argentina. The solid line and the dashed line indicate a significant slope at the 5 % and 10 % levels, respectively (on the right), while the dotted line is not significant (on the left). Superimposed on the graph is the line that represents the annual values of the Southern Oscillation Index (SOI), indicating the state of the ENSO phenomenon. Departments: General Roca (GR), General San Martín (GSM), Juárez Celman (JC), Marcos Juárez (MJ), Presidente Roque Sáenz Peña (PRSP), Río Cuarto (RC), Río Primero (RP), Río Segundo (RS), San Justo (SJ), Tercero Arriba (TA), y Unión (UN).
4.4 Trend of NDVI mean values
Another aspect to highlight of the NDVI seasonal curve results from taking the average (NDVIm) or its integral during the potential crop growing period. Figure 11 shows the temporal variation of NDVm in the different sectors of the agricultural region under study.
The NDVIm value registers the general downward trend in the region, although the negative slope is significant (p<0.05) only in RP, RS and TA. However, and although the linear model is relevant to determine the long-term decrease in NDVIm, the Figure 11 allows to recognize the fluctuating behavior of NDVIm also extended throughout the study area. At the beginning of the analyzed period, NDVIm presents high values, associated with NDVIn, which were also high during those years. Then, a marked decrease in NDVIm between 2008 and 2011 is explained by the impact of unusually dry years, under an intense and prolonged La Niña episode (De la Casa et al., 2019), and a strong increase subsequently under El Niño during 20152016 (the South Oscillation Index SOI value was added in Figure 11 to point out the El Niño-South Oscillation ENSO status each year). In this way, although the trend of NDVIm in all departments is decreasing and for some of them even significantly in terms of statistics, a certain periodic behavior linked to the close dependency between growth and state of the crops is recognized, as represented by the NDVI, and fluctuations in the weather conditions.
In this marginal region of Córdoba where agriculture has been recently established as the main productive activity, the underlying question is about the sustainability of the change in land-use through time. If the NDVIm value is taken as an indicator of the productive capacity, the gradual decrease throughout the period studied would be exposing some reduction in its potential, subordinated to the lack of sustainability of the region to maintain agricultural production capacity, or to climatic conditions have been degrading over time. Nor can it be ruled out that agricultural production systems have a lower capacity to fix carbon compared to traditional livestock systems based on pasture feeding.
CONCLUSIONS
The rain-fed production region of Córdoba experienced an intensification of agricultural land-use between 2000 and 2020, so that the planting area of summer crops (soybean and corn crops only) in each department currently exceeds 50 % of its territory. In addition to the information available in censuses and productive statistics, this change is revealed by considering different expressions derived from the NDVI seasonal variation curve: the maximum value (NDVIx), the minimum (NDVIn) and the amplitude (NDVIa). The evidence analyzed shows that NDVIa is directly related to the joint planting area of soybean and corn and, consequently, it is indicative of the agricultural use of the territory.
The analysis of the NDVI seasonal curves through time reveals substantial changes in agricultural activity in the dryland región of Córdoba. While the intensificaron of the agricultural use of the territory is evident by the decrease in NDVIn, the increase in NDVIx and the general increasing trend of the NDVIa, these changes are particularly evident in those departments where agricultural activity increased the area in a greater proportion. Thus, in the departments of MJ, UN and GSM, which constitute the core area of agriculture in the region and where the increase in agricultural area has been less, the slope of NDVIa, although positive, does not reach statistical significance (p<0.05). On the contrary, the marginal departments (GR, PRSP, RC, SJ) that in the last twenty years have increased their agricultural area in a sustained way, exhibit a significant positive trend in the NDVIa value.
The NDVIx or peak of greenness has increased its value in a general way, although with a significant character, mainly in the peripheral areas of the region. As an indicator directly linked to agricultural productivity, it constitutes evidence in favor of the fact that the incorporation of agricultural activity did not have a negative impact on productive capacity.
On the contrary, the negative trend of NDVIm extended throughout the territory constitutes an alert signal about the sustainability of agricultural production systems in the region, mainly in the RP, RS and TA sectors where the slope is significant. The progressive decrease in NDVIm could be attributed to the fact that current conditions are less conducive to sustaining initial productivity, an aspect that would be linked to the deterioration caused by agricultural intensificaron. In another sense, it could be associated with less favorable climatic conditions in recent years, or because the agricultural systems have naturally less capacity to fix carbon than livestock systems based on pastures. Discerning about the possible loss of sustainability or that the climatic conditions are currently less favorable is an aspect that must be assessed in particular.
ACKNOWLEDGEMENTS
This work was supported by the Secretaría de Ciencia y Técnica de la Universidad Nacional de Córdoba, Argentina (SeCyT-UNC) Grant Number 32720200400235CB.
Fecha de recepción: 31/05/2023
fecha de aceptación: 13/03/2024.
REFERENCES
Acker, J. G. and Leptoukh, G. (2007). Online analysis enhances use of NASA Earth Science Data. Eos, Transactions American Geophysical Union, 88, 14-17. https://doi.org/10.1029/2007EO020003 Aramburu Merlos, F, Monzon, J. P, Mercau, J.
L. , Taboada, M., Andrade, F H., Hall, A. J., Jobbagy, E., Cassman, K. G., and Grassini, P. (2015). Potential for crop production increase in Argentina through closure of existing yield gaps. Field Crops Research, 184, 145-154. https://doi. org/10.1016/j.fcr. 2015.10.001
Becker-Reshef, I., Vermote, E., Lindeman, M., and Justice, C. (2010). A generalized regression-based model for forecasting winter wheat yields in Kansas and Ukraine using MODIS data. Remote Sensing of Environment, 114, 13121323. https://doi.org/10.1016/j.rse.2010.01.010
Bolton, D. K. and Friedl, M. A. (2013). Forecasting crop yield using remotely sensed vegetation indices and crop phenology metrics. Agricultural and Forest Meteorology 173, 74-84. https://doi. org/10.1016/j.agrformet.2013.01.007
Brown, M. E., De Beurs, K. M., and Vrieling, A. (2010). The response of African land surface phenology to large scale climate oscillations. Remote Sensing of Environment, 114, 22862296. https://do¡.org/10.1016/j.rse.2010.05.005
Chang, J., Hansen, M. C., Pittman, K., Carroll, M. , and DiMiceli, C. (2007). Corn and soybean mapping in the United States using MODIS Time-Series data sets. Agronomy Journal, 99, 16541664. https://doi.org/10.2134/agronj2007.0170
Censo Nacional Agropecuario (CNA-02). (2002). Instituto Nacional de Estadística y Censos (INDEC). Ciudad Autónoma de Buenos Aires, República Argentina. https://sitioanterior.indec. gob.ar/cna_index.asp
Censo Nacional Agropecuario (CNA-18). (2018). Censo Nacional Agropecuario 2018. Resultados definitivos. Instituto Nacional de Estadística y Censos (INDEC). Ciudad Autónoma de Buenos Aires, República Argentina. https://www.indec. gob.ar/indec/web/Nivel4-Tema-3-8-87
De la Casa, A. and Ovando, G. (2007). Caracterización de la dinámica anual del uso del suelo en sistemas de producción agropecuarios de Córdoba, Argentina, por medio del análisis armónico en series de tiempo de NDVI. Revista de la Facultad de Agronomía (La Plata), 106(2), 155-164.
De la Casa, A. and Nasello, O. (2010). Breakpoints in annual rainfall trends in Córdoba, Argentina. Atmospheric Research, 95, 419-427 https://doi. org/10.1016/j.atmosres.2009.11.005.
De la Casa, A. C. and Ovando, G. G. (2014). Climate change and its impact on agricultural potential in the central región of Argentina between 1941 and 2010. AgriculturaI and Forest Meteorology, 195-196, 1-11. https://doi. org/10.1016/j.agrformet.2014.04.005
De la Casa, A. C. and Ovando, G. G. (2016). Variation of reference evapotranspiration in the central region of Argentina between 1941 and 2010. Journal of Hydrology: Regional Studies, 5, 66-79. https://doi.org/10.1016/j.ejrh.2015.11.009
De la Casa, A., Ovando, G., and Díaz, G. (2018). Secular variation of rainfall regime in the central region of Argentina. Atmospheric Research, 213, 196-210. https://doi.org/10.1016/j.atmosres.2018.06.009
De la Casa, A., Ovando, G., Díaz, G., Bressanini, L., and Miranda, C. (2018). Brecha de rendimiento del cultivo de soja estimada con el modelo AquaCrop en la región central de Córdoba, Argentina. Revista Argentina de Agrometeorología, 9, 1-19.
De la Casa, A., Ovando, G., Bressanini, L., Díaz, G., Díaz, P., and Miranda, C. (2019). Evaluación de la brecha de rendimiento para maíz tardío con distintas densidades de siembra en la región central de Córdoba, Argentina. Agriscientia, 36(2), 1-17. https://doi.org/10.31047/1668.298x. v36.n2.23613
De la Casa, A., Ovando, G. and Díaz, G. (2019). Interannual variability of seasonal rainfall in Cordoba, Argentina, evaluated from ENSO and ENSO Modoki signals and venfied with MODIS NDVI data. SN Applied Sciences, 1(6), 1624. https://doi.org/10.1007/s42452-019-1650-6
Diao, C. (2020). Remote sensing phenological monitoring framework to characterize corn and soybean physiological growing stages. Remote Sensing of Environment, 248, 111960. https:// doi.org/10.1016/j.rse.2020.111960
Fox, T. A., Rhemtulla, J. M., Ramankutty, N., Lesk, C., Coyle, T. and Kunhamu, T. K. (2017). Agricultural land-use change in Kerala, India: Perspectives from above and below the canopy. Agriculture, Ecosystems & Environment, 245, 1-10. https://doi.org/10.1016/j.agee.2017.05.002
Ghida Daza, C. and Sánchez, C. (2009). Zonas agroeconómicas homogéneas: Córdoba (No. E16/121). Instituto Nacional de Tecnología Agropecuaria (INTA). Retrieved from: https:// www.produccion-animal.com.ar/regionesganaderas/23-zonas agroeconomicas cba.pdf
Guida-Johnson, B. and Zuleta, G. A. (2013). Land-use land-cover change and ecosystem loss in the Espinal ecoregion, Argentina. Agriculture, Ecosystems & Environment, 181, 31-40. https://doi.org/10.1016/j.agee.2013.09.002
González, P. L. M., Goddard, L. and Greene, A. M. (2013). Twentieth-century summer precipitation in southeastern South America: comparison of gridded and station data. International Journal of Climatology 33(13), 2923-2928. https://doi. org/10.1002/joc.3633
Huete, A., Didan, K., Miura, T., Rodríguez, E. P., Gao, X. and Ferreira, L. G. (2002). Overview of the radiometric and biophysical performance of the MODIS vegetation indices. Remote Sensing of Environment, 83(1-2), 195-213. https://doi. org/10.1016/S0034-4257(02)00096-2
Jayawardhanaa, W. G. N. N. and Chathurange, V M. I. (2016). Extraction of agricultural phenological parameters of Sri Lanka using MODIS, NDVI time series data. Procedia Food Science, 6, 235-241. https://do¡.org/10.1016/j.profoo.2016.02.027
Johnson, D. M. (2014). An assessment of pre-and within-season remotely sensed variables for forecasting corn and soybean yields in the United States. Remote Sensing of Environment, 141, 116-128. https://doi.org/10.1016/j.rse.2013.10.027
Jonsson, P. and Eklundh, L. (2004). TIMESAT - A program for analyzing time-series of satellite sensor data. Computers & Geosciences, 30, 833-845. https://doi.org/10.1016/j.cageo.2004.05.006
Liebmann, B., Vera, C. S., Carvalho, L. M. V, Camilloni, I. A., Hoerling, M. P., Allured, D., Barros, V. R., Báez, J. and Bidegain, M. (2004). An observed trend in central South American precipitation. Journal of Climate, 17(22), 43574367. https://doi.org/10.1175/3205.1
Liu, J., Huffman, T, Qian, B., Shang, J., Li, Q., Dong, T, Davidson, A. and Jing, Q. (2020). Crop yield estimation in the Canadian Prairies using Terra/ MODIS-derived crop metrics. IEEE Journal of Selected Topics in Applied Earth Observations and Remote Sensing, 13, 2685-2697. https:// doi.org/10.1109/JSTARS.2020.2984158
Magrin, G. O., Travasso, M. I. and Rodriguez, G. R. (2005). Changes in climate and crop production during the 20th century in Argentina. Climate Change, 72(1-2), 229-249. https://doi.org/10.1007/s10584-005-5374-9
MAGyP (2021). Ministerio de Agricultura, Ganadería y Pesca de la República Argentina. Presidencia de la Nación. Estimaciones agrícolas. Retrieved from https://datosestimaciones.magyp.gob.ar/reportes.php?reporte=Est¡mac¡ones Minetti, J. L. and Vargas, W. M. (1997). Trends and jumps in the annual precipitation in South America, south of the 15°S. Atmósfera, 11(4), 205-223.
Nolasco, M., Ovando, G., Sayago, S., Magario, I. and Bocco, M. (2021). Estimating soybean yield using time series of anomalies in vegetation indices from MODIS. International Journal of Remóte Sensing, 42(2), 405-421. https://doi.org/10.1080/01431161.2020.1809736
Paruelo, J. M., Guerschman, J. P. and Verón, S. R. (2005). Expansión agrícola y cambios en el uso del suelo. Ciencia hoy, 15(87), 14-23.
Rodríguez, A. R. and De la Casa, A. C. (1990). Regiones hídricas de la República Argentina. Revista de la Facultad de Ciencias Agropecuarias (UNC), 7, 31-40.
Rolla, A. L., Núñez, M. N., Guevara, E. R., Meira, S. G., Rodríguez, G. R. and De Zárate, M. I. O. (2018). Climate impacts on crop yields in Central Argentina. Adaptation strategies. Agricultural Systems, 160, 44-59. https://doi.org/10.1016/j.agsy.2017.08.007
Saeed, U., Dempewolf, J., Becker-Reshef, I., Khan, A., Ahmad, A. and Aftab Wajid, S. (2017). Forecasting wheat yield from weather data and MODIS NDVI using random forests for Punjab province, Pakistan. International Journal of Remote Sensing, 38(17), 4831-4854. https://doi.org/10.1080/01431161.2017.1323282
Sakamoto, T, Wardlow, B. D., Gitelson, A. A., Verma, S. B., Suyker, A. E. and Arkebauer, T J. (2010). A two-step filtering approach for detecting maize and soybean phenology with time-series MODIS data. Remote Sensing of Environment, 114(10), 2146-2159. https://doi.org/10.1016/j.rse.2010.04.019
Sakamoto, T., Gitelson, A. A. and Arkebauer, T J. (2014). Near real-time prediction of US corn yields based on time-series MODIS data. Remote Sensing of Environment, 147, 219-231. https://do¡.org/10.1016/j.rse.2014.03.008
Sakamoto, T (2020). Incorporating environmental variables into a MODIS-based crop yield estimation method for United States corn and soybeans through the use of a random forest regression algorithm. ISPRS Journal of Photogrammetry and Remote Sensing, 160, 208-228. https://doi.org/10.1016/j.isprsjprs.2019.12.012
Sayago, S., Ovando, G. and Bocco, M. (2017). Landsat images and crop model for evaluating water stress of rainfed soybean. Remote Sensing of Environment, 198, 30-39. https://doi. org/10.1016/j.rse.2017.05.008 Seo, B., Lee, J., Lee, K., Hong, S. and Kang,
S. (2019). Improving remotely-sensed crop monitoring by NDVI-based crop phenology estimators for corn and soybeans in Iowa and Illinois, USA. Field Crops Research, 238, 113128. https://doi.org/10.1016/jrfcr.2019.03.015 Sierra, E. M., Hurtado, R. H. and Spescha, L. (1994). Corrimiento de las isoyetas anuales medias decenales en la Región Pampeana 1941-1990. Revista Facultad de Agronomía, UBA, 14(2),139-144.
Skakun, S., Vermote, E., Franch, B., Roger, J-C., Kussul, N., Ju, J. and Masek, J. (2019). Winter wheat yield assessment from Landsat 8 and Sentinel-2 data: Incorporating surface reflectance, through phenological fitting, into regression yield models. Remote Sensing, 11(15) 1768. https://doi.org/10.3390/rs11151768
Stepanov, A., Dubrovin, K., Sorokin, A. and Aseeva, T. (2020). Predicting soybean yield at the regional scale using remote sensing and climatic data. Remote Sensing, 12(12), 1936. https://doi.org/10.3390/rs12121936
Sun, D. and Kafatos, M. (2007). Note on the NDVI-LST relationship and the use of temperature-related drought indices over North America. Geophysical Research Letters, 34(24), L24406. https://doi.org/10.1029/2007GL031485
Suriano, J. M. and Ferpozzi, L. H. (1993). Inundaciones y sequías en la historia pampeana. Revista de la Sociedad Rural de Jesús María, 77, 20-24.
Udelhoven, T (2011). TimeStats: A software tool for the retrieval of temporal patterns from global satellite archives. IEEE Journal of Selected Topics in Applied Earth Observations and Remote Sensing, 4(2), 310-317. https://doi. org/10.1109/JSTARS.2010.2051942
Ullah, M., Li, J. and Wadood, B. (2020). Analysis of urban expansion and its impacts on land surface temperature and vegetation using RS and GIS. A case study in Xi'an City, China. Earth Systems and Environment, 4, 583-597. https:// doi.org/10.1007/s41748-020-00166-6 Verhoef, W. (1996). Application of harmonic analysis of NDVI time series (HANTS). DLO Winand Staring Centre, 19-24.
Viglizzo, E. F, Roberto, Z. E., Filippin, M. C. and Pordomingo, A. J. (1995). Climate variability and agroecological change in the Central Pampas of Argentina. Agriculture, Ecosystems & Environment, 55, 7-16. https://doi. org/10.1016/0167-8809(95)00608-U
Viglizzo, E. F, Lértora, F A., Pordomingo, A. J., Bernardos, J., Roberto, Z. E. and Del Valle, H. (2001). Ecological lessons and applications from one century of low external-input farming in the pampas of Argentina. Agriculture, Ecosystems & Environment, 81, 65-81. https://doi.org/10.1016/ S0167-8809(00)00155-9
Viglizzo, E. F, Pordomingo, A. J., Castro, M. G. and Lértora, F A. (2003). Environmental assessment of agriculture at a regional scale in the Pampas of Argentina. Environmental Monitoring and Assessment, 87, 169-195. https://doi. org/10.1023/A:1024654316879
Viglizzo, E. F and Frank, F C. (2006). Ecological interactions, feedbacks, thresholds and collapses in the Argentine Pampas in response to climate and farming during the last century. Quaternary International, 158, 122-126. https:// do¡.org/10.1016/¡.quaint.2006.05.022
Kumar Oad, V., Dong, X., Arfan, M., Kumar, V, Mohsin, M. S., Saad, S., Lü, H., Azam, M. I. and Tayyab, M. (2020). Identification of shift in sowing and harvesting dates of rice crop (L. Oryza sativa) through remote sensing techniques: A case study of Larkana District. Sustainability 12(9), 1-15. https://doi.org/10.3390/su12093586
Wan, W., Liu, Z., Li, K., Wang, G., Wu, H. and Wang, Q. (2021). Drought monitoring of the maize planting areas in Northeast and North China Plain. Agricultural Water Management, 245, 106636. https://doi.org/10.1016/¡.agwat.2020.106636
Wardlow, B. D. and Egbert, S. L. (2008). Large-area crop mapping using time-series MODIS 250 m NDVI data: An assessment for the U.S. Central Great Plains. Remote Sensing of Environment, 112(3), 1096-1116. https://doi.org/10.1016/¡.rse.2007.07.019
Zhang, X., Friedl, M. A., Schaaf, C. B., Strahler, A. H., Hodges, J. C., Gao, F, Reed, B. C. and Huete, A. (2003). Monitoring vegetation phenology using MODIS. Remote Sensing of Environment, 84(3), 471-475. https://doi.org/10.1016/S0034-4257(02)00135-9