Revista de Economía y Estadística |
Vol.LXII | N°1 | 2024 | pp. 111- 155 | ISSN 0034-8066 | e-ISSN
2451-7321
Revista de Economía y Estadística |
Vol.LXII | N°1 | 2024 | pp. 111- 155 | ISSN 0034-8066 | e-ISSN
2451-7321
Instituto de Economía y Finanzas | Facultad de
Ciencias Económicas | Universidad Nacional de Córdoba
https://www.revistas.unc.edu.ar/index.php/REyE
![]() Esta obra está bajo una Licencia Creative Commons Atribución-No Comercial-Sin Derivar 4.0
Internacional
Esta obra está bajo una Licencia Creative Commons Atribución-No Comercial-Sin Derivar 4.0
Internacional
Why do countries engage in the preferential trade agreement network?#
¿Por qué participan los países en la red de acuerdos comerciales preferenciales?
Flavia Rovira ![]()
Centro de Investigaciones Económicas – CINVE (Montevideo, Uruguay)
frovira@cinve.org.uy
Marcel Vaillant ![]()
Universidad de la República (Montevideo, Uruguay)
marcel.vailllant@cienciassociales.edu.uy
Abstract
We analyze the determinants of Preferential Trade Agreements Networks dynamics. We propose a theoretical framework based in an extension of Baldwin (1995) to rationalize the determinants of PTA formation as a way to maximize preferential market access and/or diminish market discrimination. To build the empirical model we use a Stochastic Actor Oriented Models proposed by Snijders (2001). We suppose that three main set of variables will affect the countries motivation to change their PTA neighborhood at each moment. The first is related to natural trade cost and market size. The second group is related to political economy effects. And finally, we include a variable related to trade specialization, which has not been used in earlier works to explain PTAs. Following Snijders et al. (2012) we also control for hierarchy structures of the PTA, and we extend their work by analyzing the change in this phenomenon when considering a broader period of time. Results show that the signs of usual variables behave as expected in the literature for the first period but hierarchy effect dilutes after 2004. As a contribution to existing literature, we found that trade rivalry between countries is also significant in explaining the dynamics of PTA.
Keywords: Preferential Trade Agreements, Networks
Resumen
Analizamos los determinantes de la dinámica de las Redes de Acuerdos Comerciales Preferenciales. Proponemos un marco teórico basado en una extensión de Baldwin (1995) para racionalizar los determinantes de la formación de PTA como una forma de maximizar el acceso preferencial al mercado y/o disminuir la discriminación en el mercado. Para construir el modelo empírico utilizamos un modelo orientado a actores estocásticos propuesto por Snijders (2001). Suponemos que tres variables principales afectarán la motivación de los países para cambiar su vecindario de PTA en cada momento. El primero está relacionado con el costo del comercio natural y el tamaño del mercado. El segundo grupo está relacionado con los efectos de la economía política. Y finalmente incluimos una variable relacionada con la especialización comercial, que no se ha utilizado en trabajos anteriores para explicar las PTA. Siguiendo a Snijders et al. (2012) también controlamos las estructuras jerárquicas de la PTA, y extendemos su trabajo analizando el cambio en este fenómeno al considerar un período de tiempo más amplio. Los resultados muestran que los signos de las variables usuales se comportan como se espera en la literatura para el primer período, pero el efecto de la jerarquía se diluye después de 2004. Como contribución a la literatura existente, encontramos que la rivalidad comercial entre los países también es importante para explicar la dinámica de los PTA.
Palabras claves: Acuerdos Comerciales Preferenciales, Redes
Códigos JEL: F02, F14
Fecha de recepción: 18/09/2024 Fecha de aceptación: 05/12/2024
1. Introduction
The evolution of preferential trade agreements (PTA) over the last decades shows a permanent increase in the extensive margin (number of PTA) and intensive margin (deepness of PTA). In this context, the question of what are the determinants of two countries signing a PTA or Regional Trade Agreements (RTA) has been in the literature for some time now. There is robust empirical evidence that economic determinants like distance, GDP, and similarity of economic size explain a large number of PTAs (Baier and Bergstrand, 2004). Also, the role of noneconomic variables, like democracy have been tested as determinants (Mansfield et al. 2002). Both types of determinants are usually considered by pairs of countries (i.e. the relative size of two countries deciding whether to engage in a PTA or the democratic level of either country, etc.).
Our interest is more aligned to the spirit of Baier et al. (2014) and Manger et al. (2012) who have explored the role of the network structure in the dyadic relationship between two countries. The objective of this study is to analyze the dynamics of the linkages between countries through PTA, in an attempt to highlight what are the factors that empirically and theoretically facilitate an international agreement.
Methodologically the model we use is based in a Stochastic Actor Non-directed (SANO) model, developed by Snijders (2001) and applied to trade agreement by the same author. We propose a simple theoretical framework based in an extension of Baldwin (1995) to rationalize the determinants of PTA formation as a way to maximize preferential market access and/or diminish market discrimination. All the interdependence effects that we use here could be rationalized using this perspective. The main controls are associated with natural trade cost. It is expected that when natural trade costs are smaller and so the incentives to reduce political trade cost with PTA formation increases.
The paper contributes to the literature by linking theoretic literature on trade integration with network dynamics methodology. Additionally, we introduce a novel synthetic indicator of relative commercial specialization of countries and test its effect on the probability to sign agreements. This is a directed network variable that is valued between 0 and 1, and is closer to one 1 whenever two countries compete in many of the import markets of country i.
Most of the results are in line with previous studies. In particular, it adds evidence of domino effect in PTAs, understood as the higher probability that two countries that have agreements with a third country will sign an agreement between them. But also, we find evidence that countries will more probably sign an agreement with a country where she is discriminated in sensitive items, that is a country that has a PTA with a competitor country. Finally, the level of democracy (in a rage of 0-10) has a negative effect on the probability to sign an agreement along the whole period (1994-2004). This finding is not in line with mainstream literature, and should be further study. Finally, although most effects are significant and have the same sign in the two periods analyzed (1994-2004 and 2004-2012), some difference emerge in the higher propensity of bigger and poorer countries to engage in PTAs in the second period.
The article is organized in this introduction and four more section. First, we present the problem in the context of previous literature. In the third section a description of the evolution of PTA is presented. The fourth section develops the theoretical and methodological framework. Section five presents the results and the last section highlights the main conclusions.
Baier and Bergstrand (2004) developed a model to address the question of which pairs of countries have PTAs in a given year[1]. They used a Krugman type numerical model (monopolistic competition and trade cost) with three continents and two countries in each one. Their simulations show that the net welfare gain (with benevolent perspective) for a country to make a PTA increases with: the two countries´ economic sizes (or GDPs); similarity of GDPs; their proximity to each other; their remoteness from the rest of the world, and their relative capital-labor ratios. Then a choice model is estimated in cross section for the year 1996 and the results do not reject the general result predicted by the simulation exercise.
Baier et al. (2014) take one step further including interdependence between PTA to the basic model of country characteristics. The aim is to rationalize the effects identified in the literature on trade liberalization, such as the domino effect (Baldwin, 1995) or competitive liberalization (Bergsten, 1996). This literature refers to how the incentives that a country has (net welfare gain associated to sign an additional PTA) are different according to how much preferential access to its own market has to gives as a counterpart for gaining preferential access in the market of the other country.
Baier et al. (2014) distinguish between own and cross interdependence. Own interdependence represents the idea that the number of PTA that country i and country j have with any country is correlated to the probability of establishing an agreement between them. If country i has many agreements, the probability of having one additional with j will be greater as the preferential access is diluted in the others. Also j will have incentives to subscribe with i given that it is discriminated against in this market. The cross interdependence is the effect of others countries PTA over the probability to form a PTA between two particular participants.
For example, USA during the first half of the 1990s took initiative for the creation of NAFTA as a response to the process of deepening the European Union (access to new members and the consolidation of the common market in 1992). As USA was discriminated in the neighborhood of an increasingly big market (EU) the response was to discriminate in its own neighborhood market. This is an illustration of the interdependence cross effect.
The evolution of the PTA between Latin America countries and the USA followed by the EU's reaction illustrates the interdependence own effect. The historical sequences of PTAs show it: Mexico (signed in 1994 a FTA with USA and in 2000 with EU), Chile (2003 and 2004 respectively), Central America (2006 and 2013), Colombia (2012 and 2013), Peru (2009 and 2013), and Panama (2012 and 2013). Also, the behavior of Latin America countries with the USA follows its own interdependence effect dynamic. As it is shown in the previous sequence given that Mexico has a preferential access to USA many others Latin American countries wish to have a PTA with USA.
Baier et al. (2014) simulated the sign of the effect using also the Krugman type model with intra and intercontinental trade cost. The results in terms of net welfare are a combination of trade creation, trade diversion and terms of trade effects. However, both interdependence effects could be also rationalized with a political economy model of PTA formation as it is proposed by Grossman and Helpman (1992) and applied by Baldwin (1995) with the specification of the domino effect, with a predominant role of trade diversion effects.
For the empirical approach Baier et al. (2014) use again a choice model. However, in this recent article they use a panel data variation (146 countries in the period 1960-2005) to estimate both interdependence effects[2]. The country static characteristics are the log transformation of bilateral geographic distance and a continent variable (dummy variable for the same continent countries). Both are dyadic variables for each i,j bilateral relationship. Two additional transformations of distance and the continent variables are done. The purpose is to measure remoteness in both dimensions using multilateral resistance term (MR) and then construct a bilateral variable with the simple mean between the MR variables[3]. Two types of time varying variables are used. The first two variables measure market size as the sum of natural logs of GDP and similarity as difference between natural logs GDP (both are bilateral). The second type of variables approach the interdependence dimension among PTAs: own (country variable) and cross effect (bilateral variable)[4]. To avoid endogeneity problems with time variables they lag five years each.
The empirical basic estimation is a logit model to explain the probability to have a PTA. The results when all variables are considered do not reject the general effect predicted by the simulation exercise. Distance is negatively associated with the probability to have a PTA. If both countries are in the same continent (less trade cost) the effect is positive. If both countries are -on average- remote to the rest of the world the probability to have a PTA is greater (multilateral resistance in distance), however if on average there are more countries in each continent the probability to have a PTA decrease (multilateral resistance in continent variable). Market size and difference in market size also follow the expected pattern (positive and negative effect respectively). Then the new effect introduced in the paper is the interdependence. Results do not reject prediction, related with both manifestations of domino effect (own and cross). The size of own effect is greater than cross (40 times). Many robustness checks are considered and basically all the empirical results are sustained.
The critic to Baier et al. (2014) approach could be that they applied a choice model with data in cross sectional time-series form, estimated using a logit model. This means they do not consider in a proper way the complex structure of the network as a determinant of the evolution of new linkages[5]. The critic is pertinent considering that the main identified mechanism is the network interdependence that could be characterized in a more detailed and refined way using a more proper methodological approach.
The second approach is applied by Manger et al. (2012). The motivation is similar but with a different methodological approach based on a longitudinal network analysis. The new methodology is based in a new class of model proposed by Snijders (2001) denominated ‘‘stochastic actor-oriented models’ (SAOM). These models usually are applied to directed networks (non-reciprocal links) while non-directed networks are less frequent in the literature in SAOM. Manger et al. (2012) use a modification for non-directional networks denominated ‘‘unilateral initiative with reciprocal confirmation’’. The main goal of Manger et al. (2012) is to identify a hierarchy in the PTA network according to the level of development (high, medium and low). The hypothesis is that the high-income countries have a preference to sign PTA with themselves and with medium income countries; medium income countries will do it among themselves, while all other combinations are less frequent. In Manger et al. (2012) the interdependence effects through the structure of the network are also included. However, with this new methodological approach the driver of the interdependence effects are the triangles closures (with an expected positive effect) and/or indirect ties (with an expected negative effect). The interdependence effect deals with the amount of discrimination each country faces in market access to the global market. Each country when considering to proposing or accepting a PTA wants to increase global markets access (increasing positive discrimination and /or diminishing negative discrimination).
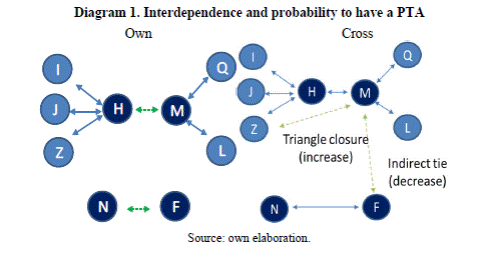
The Diagram 1 displays the type of interdependence previously identified. In the left panel we show the own interdependence effect defined by Baier et al. (2014): the probability to have a PTA between H and M increases with the number of agreements each have with third countries (3 and 2 respectively in the example). This is a monadic type effect, i.e. it depends on each actors´ characteristics. The Baier et al. (2014) cross effect means that the probability to have a PTA between N and F increases along with the number of PTAs that the rest of countries have. This effect is dyadic as it changes for each pair of NF relationship.
In the right panel the interdependence effect as specified in Manger et al. (2012) considers the increase of probability of a PTA between M and H by the incentives to closure triangles (this means to have direct access to a market that otherwise M will have only indirect access). In the opposite the probability to sign a PTA decreases if as a result M creates a new indirect tie (distance two path to F).
The period of the data base (1962-2004) is similar to Baier et al. (2014)[6]. Manger et al. (2012) considered that countries´ rationale for engaging in PTA change over a long period, so estimation is divided in two samples: 1962-1993 and 1994-2004. The result is presented for the second sub period 1994-2004 and starts with the creation of NAFTA. In this second sub period is when the density of the network accelerates its growth pattern. One fundamental difference from earlier studies is that they consider the European Union as a single actor and the data set comprises at most 145 actors. As the European Union behave as a national jurisdiction in trade policy matter, each time the EU sign a PTA with third countries imply several changes in bilateral relationships.
Manger et al. (2012) results show two types of interdependence effects. The first is similar to the own interdependence effects previously mentioned. Countries want to have an additional PTA, because the satisfaction function increases in the degree (number of PTA). The other new interdependence effect comes from the fact that countries prefer paths with triangle closure compared with indirect ties (Diagram 1). The other result is related to the types of countries, considering the level of development. It is twice more likely to have two high income country or a high income and a medium income country, than two medium income country engaged in a PTA. The other combinations are much less possible. They use other controls: geography (through distance); the level of trade openness; and the type of regime using a democracy index. Later, Manger and Pickup (2016) based in the observed association between the propensity of PTA and democracy status in Manger et al. (2012), extended the analysis to a more complex framework, adding a new related network which also could explain democracy behavior and its interaction with PTA formation.
3. PTA Evolution
This section provides a brief description of the evolution of PTA network connections among countries over a period of forty years. We use Baier and Bergstrand (2017) PTA database. The PTA network can be characterized based on two assumptions in relation to the European Union. The first would be to consider the EU members as separate countries as Baier et al. (2014) do. The second is to explain EU agreements with third parties, like the rest of the agreements but to leave out of the analysis the growth in EU membership and the clique of intra-EU trade agreements that this phenomenon generates. The latter is the path Manger et al. (2012) declare to undertake. This assumption is consistent with the idea that the actor who takes the decision to engage in new agreements with third parties is the complex actor EU. Treating the EU as one actor has the technical complication that the number of countries (nodes) that defines the PTA network changes depending on changes in EU membership.
The descriptive results of this evolution are presented in Figure 1. It is clear that in the long period from the beginning of the eighties to the beginning of the nineties no significant changes occurred, it is from 1992 that the acceleration in the growth rate of PTA takes place. In addition, Figure 1 shows the two developments considering the EU countries as separate countries or as a single country.
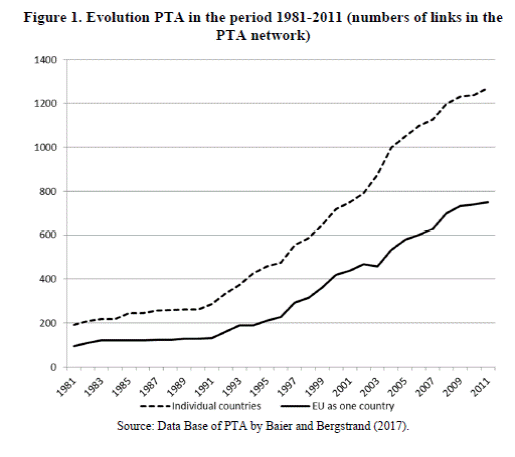
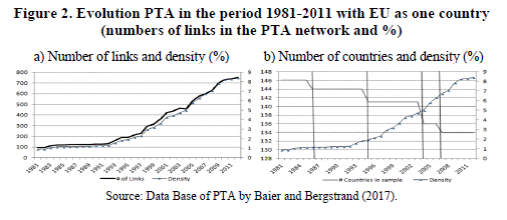
In Figure 2 data only for the case with the EU as one country is presented combined also with the value of the network density (Density=#Links/(C(C-1)), C=#countries). The evolution shows that at the beginning of the nineties density was a bit more than 1% and at the end of the whole period in 2012 more than 8%. Number of countries decreases is the result of the permanent increase in membership of the EU (see Figure 2.b)). Vertical divisions in this figure account for moments of changes in EU composition.
In Figure 3 the structure of the network with all types of reciprocal trade agreements is presented (Partial PTA- PPTA- are excluded)[7]. For reasons that will be clearer later, the analysis will be divided in the period 1994-2004 consisting of 140 countries and 2004-2012 with 133 countries. Here, the countries from EU are considered as one and the continents are distinguished with different colors at nodes level. We show the stock of agreements at the beginning and at the end of the period of analysis, and the changes that occurred in the middle time. It is worth to notice that at the beginning almost half of the countries were isolated. Also, the pattern of connection was mainly regional, with a relevant majority of connections being within the region, and only 1 fifth of them connecting different geographical areas.
By 2004, the number of isolates diminished to near a third of its initial value, along with the general growth of network connectivity. The number of links more than tripled in ten years, and many of them connected countries in different regions.
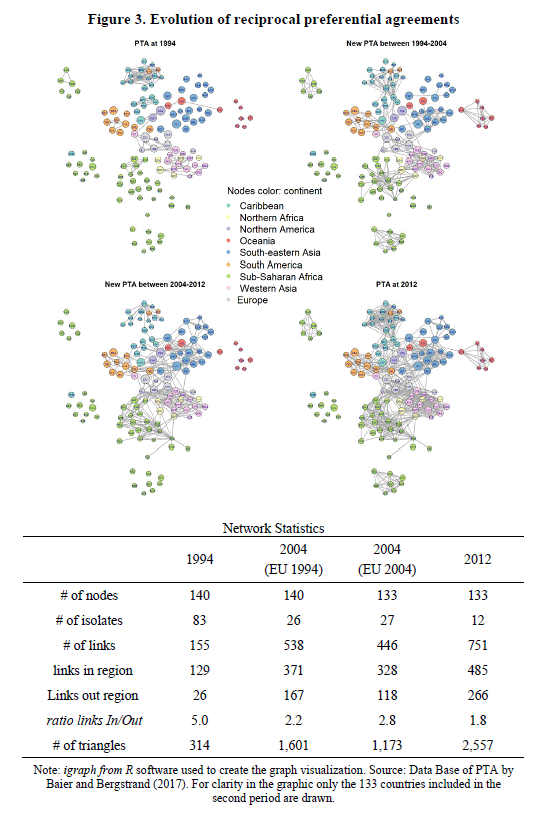
At the end of the period the regional pattern is still evident but continents are also connected between them through countries that act as bridges. This is the effect of the process of bilateral liberalization that took place mostly in the last decade of the period. It should be noticed that there are almost no isolated countries in this last picture of PTAs.
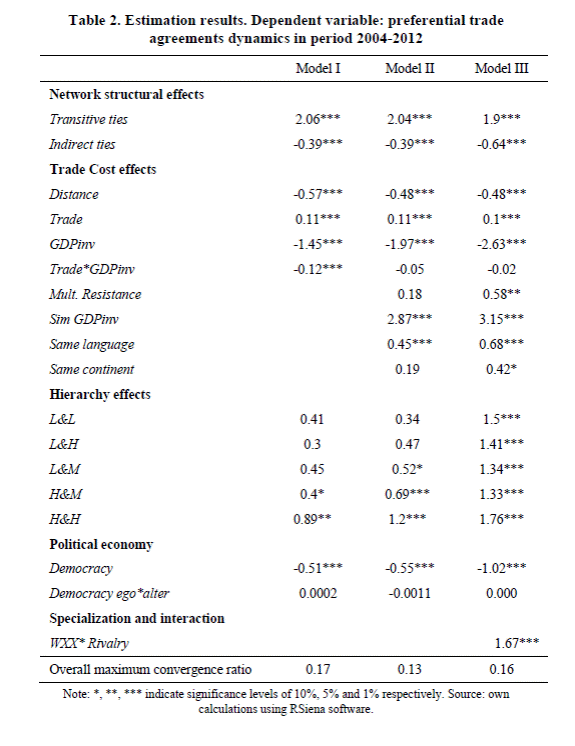
Further, many socioeconomic variables can be related to the dynamics of PTA formation. In Figure A.1 in the appendix, we show some partial evidence on two of them: wealth measured through normalized GDP per capita and size measured through normalized GDP. The partial evidence indicates that wealth is positively related to the connectedness of the countries in the PTA network, even though towards the end of the period the relationship is less steep. On the opposite side, the relation between size and degrees was negative at the beginning (big countries were less integrated in the PTA network) and became positive towards the last year.
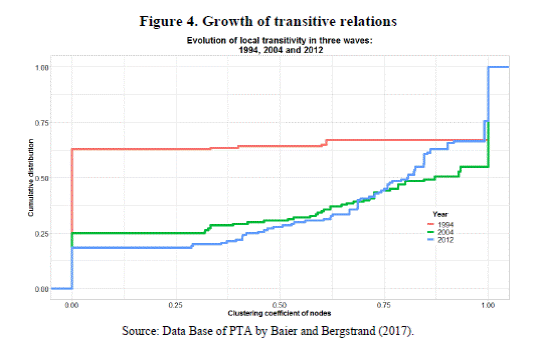
Finally, as Manger et al. (2012) address, behind the dynamics of PTAs there are factors related to the network structure of PTAs. As a simple example, we show the evolution of the transitivity of the network in three years of our sample: 1994, 2004, and 2012. The transitivity is understood as the propensity of countries to close triangles among them, which is to make a direct tie (sign a PTA) to a country when it already has an indirect tie. The transitivity is measured through the cluster coefficient of nodes. In Figure 4 we show the empirical cumulative distribution of this coefficient for all countries for the three years. It is clear that the propensity to close triangles has been increasing with time: while cluster coefficients where concentrated around zero or lower values at the beginning of the period, in later years the frequency becomes heavier for higher values of the index.
4. Theoretical Model and Methodology
4.a. Government value function to sign PTA
The two mechanisms identified in the literature are sustained with different arguments. Baier et al. (2014) used a simulation model that allows building a gain for trade function according to the perspective of a benevolent government. It is a monopolistic competition model with transport costs, and a particular geography of the world economy (3 continents and 2 countries in each). This model is calibrated with parameters of the literature, and simulates different types of agreements. On the basis of simulations, the signs of the effects are identified and then contrasted with observed data. It is a consistent methodology that seeks to set the micro foundation of the applied analysis. However, the simplification of the theoretical reference model fails to consider many other effects.
In the first place, the political economy of PTA creation is not considered. For example, the theoretical approach as it is developed by Grossman and Helpman, (1995) and Baldwin (1995). Secondly the complex relationships of networks cannot be included given the stylized geography of the proposed simulation model. The estimation method does not allow capturing these other network interrelations either, which seem to be important as we show in Figure 3.
In the case of Manger et al. (2012) the argumentation is less ambitious. They describe the mechanisms through which the PTA generate gain for trade through the effect on prices and trade volume. The theoretical reference is Baldwin (1995) despite the fact that the argument of this article is restrictive in terms of the dynamics of the domino effect. In fact, what is modeled in Baldwin (1995) is a country that wants to join a pre-existing agreement and the balance of the decision of the country entering into the agreement depends on the number of members of the agreement considering gain in market access and domestic resistance to preferential trade liberalization. It is an example that stylized the announcement of the European common market and the effect on enlargement in the membership of the EU. However, this is not the typical case of the international economy. The typical case is linked to a bilateral PTA that assesses whether they subscribe or not an agreement. To do so they consider own pre-existing agreements as well as the PTAs of the eventual partner.
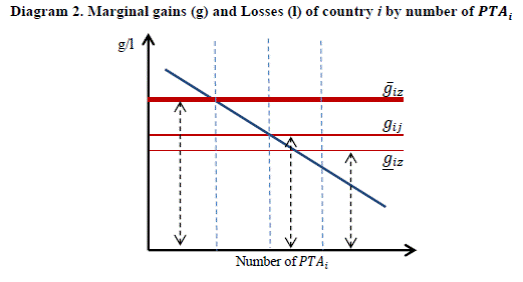
In our case, the main idea is that the creation of PTA is always a reciprocal exchange of market access. There are two types of effects. First, if a country gives access to its own market has a negative effect on the government value function that it seeks to maximize (see equation 1). Import substitutive sectors will be worse with a new PTA which would lead them to persuade government to drop the integration proposal. In Baldwin (1995) terms this is the resistance function of the trade liberalization. This resistance decreases with the number of PTA, ought to the marginally less preference that is given to each new partner. When liberalization is more multilateral the cost associated with domestic production adjustment will be smaller and also the trade diversion cost decreases. Trade preferences are diluted among many partners and the government value function increases.
Then gains depend on the size of the market that can be accessed and the size of preference in the market of the partner. The higher gain would be associated to accessing large markets in a preferential way. Incentives for export sectors are associated to having preferential access or to be less discriminated in the greatest possible number of markets, since this widens the size of market access that is gained (prices and trading volume). In addition, the interest of exporters becomes predominant as liberalization evolves and the number of agreements grow. Getting access to a new country´s market is always understood as beneficial and will be more so as this access is not shared with others.
If the potential partner with whom there is an opportunity to sign an agreement already has a PTA with other countries then, for exporters, the agreement will have the benefit of reducing discrimination. Minimizing discrimination from a specific market can further impact the value function when the country that already has access is a rival in terms of specialization, i.e. if it specializes in exporting the same products.
The interdependence variables previously referred are related to the complex form of the interaction of the PTAs with others and its influence in the probability that a certain bilateral relationship could lead to a new PTA.
The other variables that are used in the function of government preferences are linked to the natural costs of trade. All the variables that imply more proximity and similarity (i.e. which reduce natural trade cost) increase the incentives to reduce non-natural trade costs which are associated with the particular trade policy established by each government. Gains for trade for reducing non-natural trade cost will be higher for those countries in which 'natural' trade costs are smaller. This is the well-known case of natural blocks pointed out by Krugman (1991 and 1992).
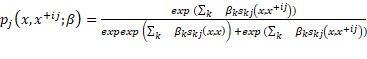
In equation (1) we present a possible reduced form of the preferences of political government of country i who try to balance offensive (exporters) and defensive (import substitution sectors) interest.
![]() )-
)-![]() ) (1)
) (1)
where: ![]() ) is the gain function that depends in the market access that each
country j=1,.., P gives to country i (
) is the gain function that depends in the market access that each
country j=1,.., P gives to country i (![]() ;
; ![]() ) is the loss function that depends in the market that i gives to
each country j=1,.., P.
) is the loss function that depends in the market that i gives to
each country j=1,.., P.
In Diagram 2 a simple demonstration of our argument is presented. Marginal losses are a decreasing function of own PTA associated with a decreasing in marginal preferences given to each new partner and the gradual reducing in trade diversion. Then gain could have different levels and are specific to each partner. When gains increases associated with size of the market and/or less natural trade cost, the possibility to have more benefits associated with a particular agreements increase, and as we are going to show in the next sub section, also the probability to have an agreement.
4.b. SANO Model
Our methodology follows Manger et al. (2012) approach which uses the modification for stochastic actor in non-directed network (SANO) as it is developed by Snijders and Steglich (2009). In this type of models, the adjacency matrix of the network is always symmetric (if i is tied to j, then j is tied to i) this is the case in the set of reciprocal trade agreements we study.
The dependent variable is a sequence of temporal networks ![]() represented by a binary adjacency matrix which take value of one
represented by a binary adjacency matrix which take value of one ![]() if there is a PTA between country i and j and zero
otherwise (
if there is a PTA between country i and j and zero
otherwise (![]() [8]. Time is continuous but we only observed the network in different
moments. Then
[8]. Time is continuous but we only observed the network in different
moments. Then ![]() with M≥2 are
subsequent moments for which there is an observation of the network status.
with M≥2 are
subsequent moments for which there is an observation of the network status.
![]() with
with ![]()
![]() (2)
(2)
The matrix ![]() is a square C x C matrix, where C is the number of actors
(countries) at that moment. By construction the diagonal of the adjacency
matrix is zero (
is a square C x C matrix, where C is the number of actors
(countries) at that moment. By construction the diagonal of the adjacency
matrix is zero (![]() ). It is assumed that from an initial observed
). It is assumed that from an initial observed ![]() , an unobservable continuous-time Markov process causes shift
towards
, an unobservable continuous-time Markov process causes shift
towards![]() . At each time t, only one country has the possibility to make a
change in the network (create a new link with another country). The probability
of change at each time t depends on the current state of the network.
. At each time t, only one country has the possibility to make a
change in the network (create a new link with another country). The probability
of change at each time t depends on the current state of the network.
The likelihood of change in the network depends on the time and on
the countries´ options. In every moment of time in which a country has the
chance to make a change, it can choose to do it or not, and if it does make a
new link proposal it needs to decide to whom. In a time t, in a State of
the network ![]() each player i has a rate of change
each player i has a rate of change ![]() , where
, where ![]() is a statistical parameter, which may depend on m and also
can depend on actor covariates and on their degrees (Snijders and Pickup,
2016). The waiting time until the next opportunity for change by any actor has
the exponential distribution:
is a statistical parameter, which may depend on m and also
can depend on actor covariates and on their degrees (Snijders and Pickup,
2016). The waiting time until the next opportunity for change by any actor has
the exponential distribution:
![]() (3)
(3)
with: ![]() . The expected duration time is
. The expected duration time is ![]() .
.
The probability that the next opportunity to change is for the actor i is:
![]() (4)
(4)
In every moment of time when it has the chance to choose, the
actor i observes the network status ![]() and evaluates the gain that gives him to
move to a new state
and evaluates the gain that gives him to
move to a new state![]() , evaluating the networking function
, evaluating the networking function![]() . So the satisfaction function of the change in status is
presented in the following equation:
. So the satisfaction function of the change in status is
presented in the following equation:
![]() (5)
(5)
where ![]() is the index of effects;
is the index of effects; ![]() -have a standard Gumbel distribution.
-have a standard Gumbel distribution.
The evaluation function enters the probability calculations of
both countries: the one that is initiating a tie and the other that must to
confirm the tie. The probability that country i wants to create or
destroy a tie with country j ( ![]() ) is a ratio of the satisfaction of change the link with j,
compared with the aggregated satisfaction of doing all possible things country
i can do in the network. It is defined, as usual in generalized linear models,
as a linear combination.
) is a ratio of the satisfaction of change the link with j,
compared with the aggregated satisfaction of doing all possible things country
i can do in the network. It is defined, as usual in generalized linear models,
as a linear combination.
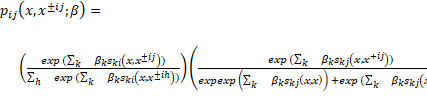
 (6)
(6)
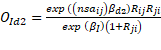
There are different alternatives to coordinate the will of both actors in the process of connecting. As in Manger et al. (2012) we choose the unilateral initiative with reciprocal confirmation of the partner[9]. In this modeling one partner takes de initiative proposing a new tie or dissolving an existing one; the other actor has to confirm, otherwise the tie is not created; for dissolution, confirmation is not required. According to Snijders and Steglich (2009): “one-sided initiative with reciprocal confirmation is in general the most appealing simple representation of the coordination required to create and maintain non-directed ties”. Once i had the initiative of inviting j to join in a PTA, the probability that country j accepts the PTA offer is:
 (7)
(7)
Summarizing both results the probability that a tie is proposed
and confirmed, sustained or eliminated is:![]()
For estimation purposes, we use the longitudinal analysis package Simulation Investigation for Empirical Network Analysis (SIENA; Ripley, Snijders, and Preciado López, 2011) in R programming language[10]. Given the relative size of the sample (140 nodes) we performed the estimation with the conditional method of moment estimation, where conditioning variable is the total number of observed changes ("distance") in the network PTA variable.
SIENA[11] uses certain statistics that reflect the parameter values for the function. The final parameters should be such that the expected values of the statistics are equal to the observed values. Expected values are approximated as the averages over many simulated networks.
Observed values are calculated from the data set. To find these parameter values, an iterative stochastic simulation algorithm is applied, in which (a) the sensitivity of the statistics to the parameters is roughly determined; (b) provisional parameter values are updated iteratively by simulating a network according to the provisional parameter values, calculating the statistics and the deviations between these simulated statistics and the target values, and making marginal updates; (c) the final result of that procedure is used and it is checked if the average statistics of many simulated networks are indeed close to the target values.
Then, the SIENA algorithm is based on repeated simulation of the evolution process of the network. The method of moments estimation algorithm is based on comparing the observed network (obtained from the data files) to the hypothetical networks generated in the simulations. Standard errors are estimated with the likelihood ratio method.
5. Empirical models and results
The analysis of PTA dynamics starts in 1994, coinciding with the beginning of the period where the proliferation of agreements started and EU extended its membership (see Figure 2b). The cut of the analysis into two periods follows the dynamic of countries entering the European Union, between 1994 and 2012[12]. The first period -from 1994 to 2004- represents a world with 140 countries. The second period -from 2004 to 2012- represents one with 133 countries.
For each period we build the dependent variable: an array of subsequent binary networks representing the evolution of PTAs between all countries. The observed networks (moment of the observations) represent annual sequence. We use Bergstrand (2017) database on PTA[13], selecting only the agreements classified as Free Trade Agreements, Customs Union, Common Market or Economic Union.
5.a. Variable definitions
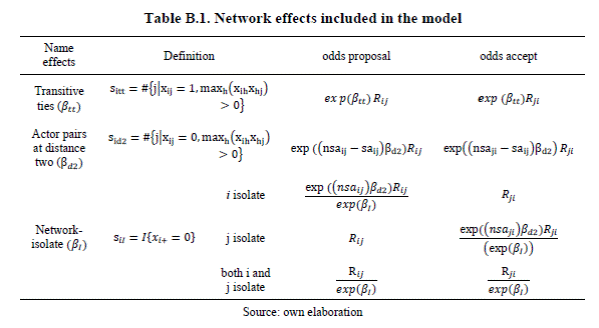
5.a.1. Network effects
We use network effects to account for the interdependent effects: the transitiveness of relations as means of avoiding the discrimination and the initial cost of integrating to the network. In particular for the period 1994-2004 we test three basic effects (formal definitions can be found in Table B.1), the first of which is used also in Manger et al. (2012):
● Only indirectly tied at distance two. This effects measure the number of countries which are connected with country i only through one intermediate country. A negative coefficient in this variable would mean that countries are not satisfied by keeping only indirect ties to other countries (see definition in Table B.1).
● Transitive ties effect. Measures the number of countries to which a country i is connected both directly and indirectly. A positive coefficient of this variable can be interpreted as a higher probability of countries to sign agreements to those countries with which its partners already have an agreement (see Table B.1).
● Network isolate. This effect is introduced to account for the basic fundamental of a sparse network (see Table B.1). This effect accounts for the fact that some countries in earlier stages of the integration could have preferred not to sign any agreements. In fact, at the begging of the period the trade agreement network was highly sparse. In such a case the probability to have an agreement with anyone was low because the potential gains need to be high enough as to offset the losses which are relatively more important as no country has yet accessed the market.[14]
The three networks effects have coverage over all the possibility of interdependence among PTA in the network and the different ways market access discrimination is affected. The identification of the effects is related to sharing (sa) and not sharing agreements (nsa) between the proposing country i and the potential partner j.
5.a.2. Covariates effects (I): Trade cost and market size
The second group of variables is associated to trade cost (natural or political), market size and bilateral trade relations. In the SAOM model, these variables are called actor-dependent covariates (vi) that enter the evaluation function through the value they have for either i or j when considering monadic covariates (for instance democracy), or as attributes of pairs of actors vij when considering dyadic covariates (for instance geographic distance, languages, same sub-continent). The set of variables used to control for natural costs and market size are:
● Geographical distance, different languages and alike are related to higher costs to trade and so indirectly they limit the net gain of the agreement. We expect that natural trade costs impact negatively on the probability of signing a new agreement between two countries, as it has been proved in earlier works. We use static binary matrices to account for these effects, except for distance matrix which is expressed in logs.
● Multilateral geographical distance, which accounts for how far each country is from all the rest of the world (the mean of the distance to every other country). Additionally, we create a dyadic variable equal to one if two countries belong to the same subcontinent.[15] Both variables have been used in Baier and Bergstrand (2004) and Baier et al. (2014) but not in Manger et al. (2012).
● Trade. We would expect that the previous trade relationships measured by a sequence of networks of logs of total trade (lagged four years), would positively impact the probability of signing a new agreement. This means, given that a country i already has non-preferential access to country j market it would be expected that she can have gains in further deepening trade (lowering costs of imports) having better access to j´s market.
● GDP, with an unclear expected sign in our model. On the one hand the size of the market could make it more attractive for exporters, although on the other hand the size of the alter might be related to greater threat to own markets and could generate more resistance. Manger et al. (2012) found a negative impact of alter’s size on the probability of signing a PTA in the period 1994-2004. We test this variable in our data for the same period and analyze the result in the following period. We add an additional dyadic effect on this variable following BM: similarity of GDP. This variable accounts for the relative size of countries, then a positive sign means that the more similar (big or small) two countries are, the more probable it is that they engage in a PTA agreement.
5.a.3. Covariates effects (II): Hierarchy
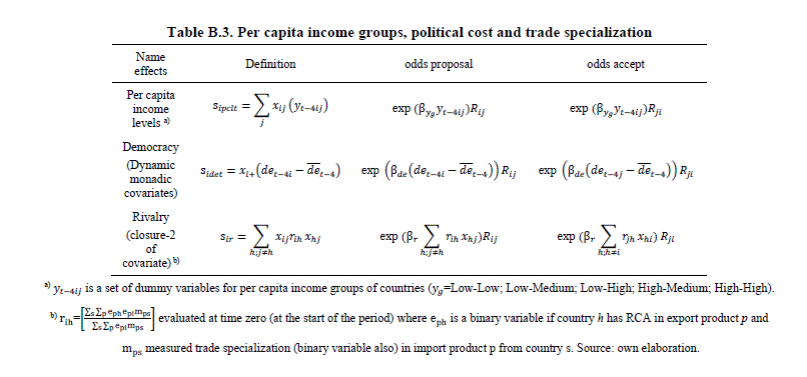
Hierarchy, a set of variables linked with the economic developing level of countries. This effect was introduced to explain the dynamic of PTA agreements in Manger et al. (2012), who found a significant effect for the period 1994-2004. Following their work, we built binary matrices using the World Bank classification of Low income (L), Medium income (M) and High income (H) countries. We constructed five matrixes (L&L, L&H, L&M, H&M and H&H) for every year.
5.a.4. Covariates effects (III): Political cost
There is a vast a literature about democracy consolidation and trade. PTA promotes trade and then trade influence in the democratization process. From a theoretical perspective there are different alternative mechanisms to explain how more trade could influence the probability of democratization. Acemoglu and Robinson (2004) sustain that trade impact through its effect over income inequality and the probability of democratic consolidation. However, the opposite could happen as they show and so in theoretical terms there is not a monotonic relationship between trade and democracy consolidation. If more deep trade relationships imply new growth dynamic, reducing inequality then non democratic regimes could be more stable. With some configuration of factor abundance this could have happened, as it could be de case of many Asian countries in the recent periods.
Manger et al. (2012) shows that the influence of democracy acts in two different ways: the greater level of democracy diminishes the probabilities of making new agreements, but on the other hand when a democracy signs an agreement it will be more probably with another democracy. Later contribution by Manger and Pickup (2016) introduces the endogeneity of democracy and propose a new methodology to estimate the influence of democracy in PTA formation and the other way relationship PTA formation on democratization. For that purpose, they use a two-network framework (probability of PTA formation and democracy behavior). Its results, shows that for the period 1973-1983 and 1983-1993 the effect of democracy on probability of PTA formation is positive.
Previously, Mansfield, et al. (2002) verified this positive effect of democracy for a longer initial period of PTA evolution (1951-1992) when its growth path was much slower than in the two last decades. However, Manger and Pickup (2016) evidence for the recent period 1994-2004 is different. In line with the previous paper by Manger et al. (2012) only a positive interaction effect between ego and alter democracy is obtained. Again, they only highlight the fact that two strong democracies have greater probability than a PTA between a strong and a weak democracy, however this also happened with two autocracies as its own results shown.
Then, following Manger et al. (2012) a monadic variable democracy is included in the model. Democracy is a dynamic variable that ranges from -10 to 10 with only a bunch of countries positioned as full democracies[16].
5.a.5. Covariates effects (IV): Trade specialization
Finally, we introduce in our model a dimension that has not been accounted for in previous approaches to the dynamics of PTA. We refer to dyadic trade specialization variable: trade rivalry. Trade rivalry measures the extent to which two countries are specialized in exporting to the same markets, this means they compete for client countries. The construction of this variable follows the logic of the product space[17] in the sense that it’s a measure of proximity between trade specializations of countries. The matrix then is valued between 0 and 1, being closer to 1 whenever two countries compete in many of the import markets of country i.
The effect seeks to identify in a more precise way the motivation of engaging in a PTA to reduce discrimination specifically with competitors. To cite an example of high mutual rivalry, consider the case of USA and the EU. In fact, their rivalry is in the top 3% highest of joint rivalry distribution. Regarding the marginal distribution of rivalry by country, they are also in the top position of rivalry of each other. Both countries being trade rivals we postulate that is an incentive for the move they made in Latin American countries. As USA gets preference in this markets it increases the incentives of EU to also sign PTA in order to reduce discrimination in those markets. The historical sequences of PTAs are a clear example: Mexico signed in 1994 a FTA with USA and in 2000 with EU, Chile did it in 2003 and 2005 respectively, Central American countries in 2006 and 2013, Colombia in 2012 and 2013, Peru in 2009 and 2013, and Panama in 2012 and 2013.
This variable is then a version of the own effect mentioned in Baier et al. (2014) but using a different empirical approximation.
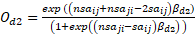
In Diagram 3 we show that in order to reflect the described phenomena, the rivalry variable needs to interact with the network variable (connections of alter in the PTA network). The effect which allows to measure this is the closure of covariate (WXX): an interaction between network effects (X) and a covariate (W) in which actor i will consider in her decision of connecting to actor j the fact that she already has a link to actor h, and that h and i have a high value in the covariate. A positive effect means that if i and h are trade rivals, and h has preferential access to j’s market, there is a bigger probability that i will sign a PTA, relative to a case in which h would not be a rival of i.
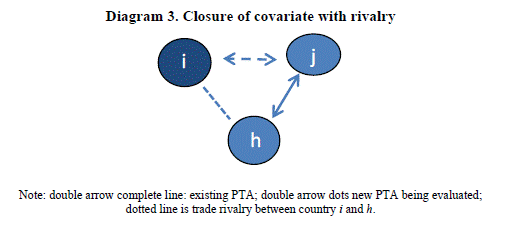
Following the analytical definition of this effect (see Table B.3) the rivalry of i in j depends on the sum of all degrees of j weighted for the rivalry that i has with all j´s partners. So it will usually be higher with the more connected countries (i.e. positively correlated with de degree of alter) but it will also depend on the rivalry of each country with alter partners.
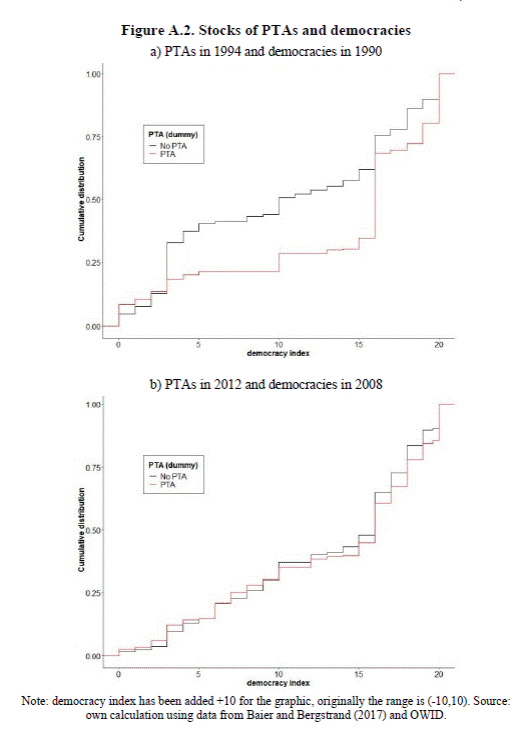
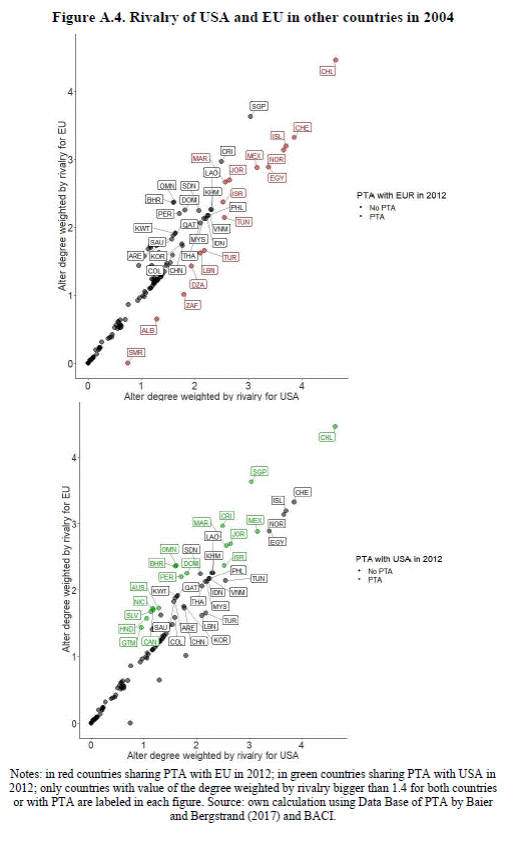
In Figure A.3 we exemplify the case for the European Union in both periods, considering the rivalry they face in all possible partner´s markets, and the degree of these markets (i.e. how connected they are). While it is clear that both variables are positively related, there are variations between them that respond exclusively to the rivalry. For instance, in panel b while Egypt is the country with the higher degree in the sample, in terms of rivalry weighted degree with the EU, it is at the same level than Mexico. It is clear also in this example that by 2012, the EU had signed PTAs with countries where it faced a relatively high rivalry.
Finally, in Figure A.4 we show the example of how the rivalry weighted degree (the effect we are measuring in our model) for the EU (USA) is affected when USA (EU) has a PTA with a third country. In the figure, we color those countries that had PTA by 2012 with the EU (panel a) and with USA (panel b). It is clear that countries with which EU had PTAs are below the diagonal, that is USA faces more rivalry in those markets. And the same occur about the position of those that have PTA with USA (positioned above the diagonal).
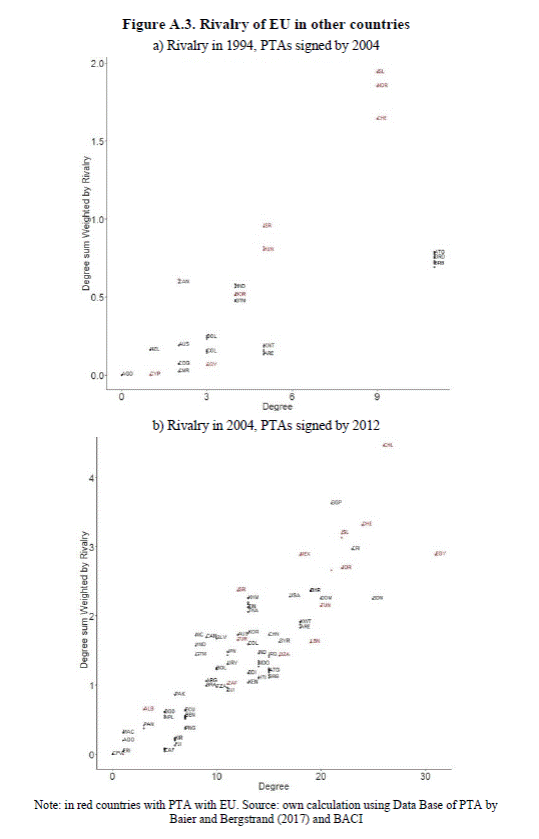
5.b. Results
Table 1 presents the parameter estimates for period 1994-2004 for two models. Estimates can be used to calculate the estimated effects of own actor and dyadic covariates and structural network effects on the probability of a tie formation. The estimated parameters for each effect should be interpreted as log-odds ratios[18].
It is also worth to say that this effect measures both the tendency to diminish discrimination at destiny, but also in the reciprocal way it captures the value of giving preference to a country when the market is already open to similar (rival) countries. In fact, both effects when measured for ego and alter are collinear. For this reason, we only include the former.
In Model I we tried to simulate that of Manger et al. (2012), although it has some changes in the structural network effects due to the fact that we are using a different PTA database, and in some cases different covariates sources.[19]
The coefficients of the network structural effects are in line with the previous literature (Manger et al., 2012) and with our hypothesis of high entering cost into the trade agreements networks. All three effects are statistically significant (t>2) and have the expected signs. It is more probable that countries sign PTA with other countries with which they already have indirect ties: if my partner has an agreement with another country, I will have higher incentives to sign with that third country than to any other. The positive and significant sign of isolate should be interpreted as a fixed cost to sign agreements (similar to a constant in the origin) and is linked with the political economy of trade specialization and adjustment cost. In fact, during the whole period many countries stay isolated.
The hierarchy effect of PTAs is captured in the signs of variables: L&L, L&H, L&M, H&M and H&H. With our data, we capture only partially this effect in Model I. In fact the first three parameters have the expected sign: negative odds ratio of that a PTA will be signed between two poor countries, or between a poor one and a middle income one, or a poor and a high income relative to an agreement between two middle income countries (omitted dummy variable in the model). What is contradictory with the hierarchy effect is the fact that also the two latter variables have negative coefficients, although the estimate of H&M parameter is not significant. A probable explanation for the weak evidence of hierarchy in this period could be related to the selection of countries, in particular the fact that we left aside all rich countries from the European Union.
The natural trade costs effects also have the expected signs. In period 1994-2004, only distance is statistically significant (not effect of continent and language variables), indicating that geographical proximity induces more chances of signing a PTA.
In relation with market size the negative sign in GDPinv can be interpreted as the existence of resistance to open the market to big countries. The strength of previous trade relations is positively and significantly correlated to the probability of signing PTAs (positive and significant sign in Trade)[20]. But, the negative sign in Trade*GDPinv means that the previous effect is lower when the two countries have more intense dependent trade relations in the past. Again, if we have as a basic framework a political economy model of PTA formation this could imply more market access liberalization and political cost.
Stronger democracies have lower probability to sign PTAs (negative effects on odds ratio) in relation to weaker democracies or autocracies. The sign and significance of this parameter are robust to alternatives specification of the model. This result is in line with that of Manger et al. (2012) however the interpretation they did is different[21]. They also obtain a negative significant sign of democracy and the probability of sign a PTA. However, Manger et al. (2012) find also a positive sign in the interaction effect: ego*alter democracy for the same period 1994 to 2004. They interpreted that when both countries are democracies the probability to have PTA is greater but is not the only possible lecture. If two countries are strong democracies (relative to the mean), then the interaction effect (ego*alter democracy) could imply a greater probability to sign a PTA but also this happened when both countries are less democratic than the mean (see Appendix B). This is not observed by these authors in spite of the fact that its own results show that. In summary, in Manger et al. (2012) the probability that two autocracies sign an agreement is 95% greater in comparison with two strong democracies. This result is consequence of the positive ego alter interaction effect which generate a non-monotonic relationship between PTA probability and democratic status.
This non monotonic relationship happens also with PTA formation. This fact could help explain why in different periods depending of the sample of countries the effect is alternatively positive or negative as it is documented in the period of more accelerated PTA evolution (1994-2004 and 2004-2012).
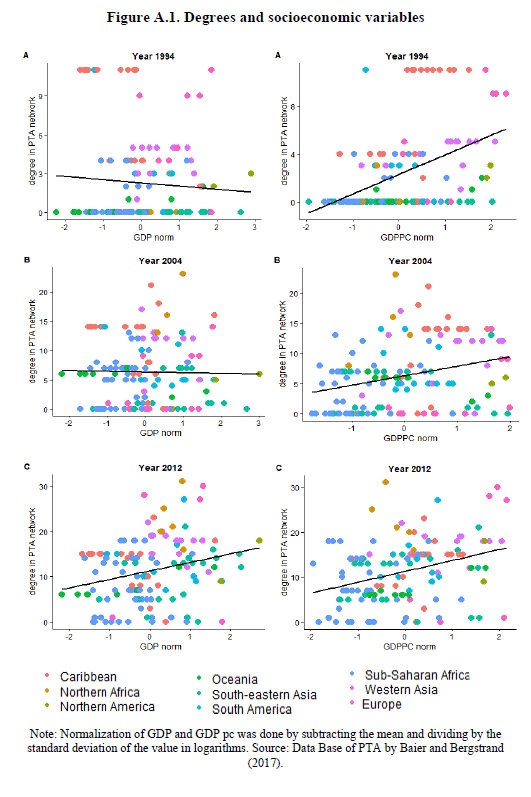
In Figure A.2 we show how democracy and PTA formation have in our data a nonlinear nature in 1994: strong autocracies (index of democracy lower than -6) have a bigger share of PTA, for those countries in the middle of democracy index (-5 to 5) the distribution of countries without PTA gives a significant jump, and the strong democracies (index higher than 5) are again more connected. By the end of the period (year 2012, see panel b) in Figure A.2) the pattern is simpler; the distribution of PTAs engagement is higher for weaker democracies and is lower for stronger democracies.
In Model II we include a set of variables that are in line with our conceptual model, extending the variables affecting the natural trade cost and market size effects. First, we test the role of multilateral resistance in the probability of signing PTAs as it is in the Baier et al. (2014) specification. We are in line with its results of a positive sign in this effect. The positive sign can be interpreted as the greater need of geographically isolated countries to sign PTAs in order to reduce the natural cost of trade required to access markets, in relative terms to more central countries.
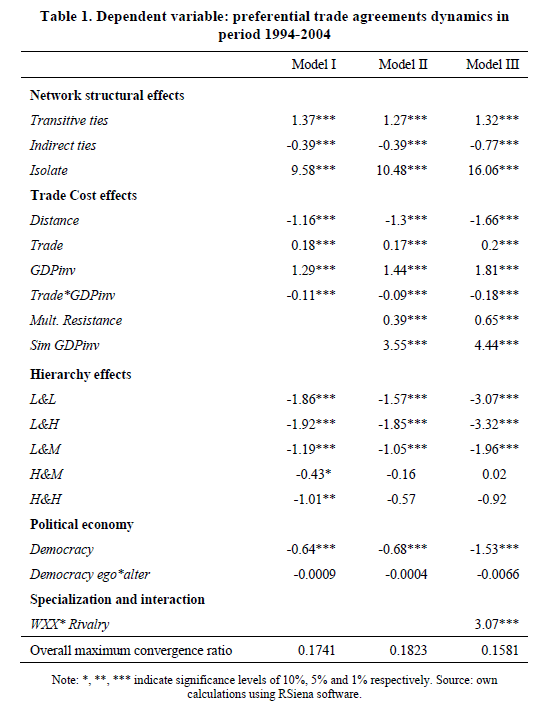
In this model we also included a variable that accounts for homophily between countries based on size: GDP similarity. The positive coefficient means that countries more probably will sign agreements with other countries of similar size, given all other effects are equal.
In Model III we add the specialization variable. We find that the effect of closure of Rivalry to explain the dynamics of PTAs is positive and significant, providing evidence of the higher incentive to sign PTAs with markets where countries face discrimination in favor of trade rivals, or from a different perspective, the lower resistance that follower countries face to enter a market with preference, when rivals already entered.
We carried on a Wald test of individual and joint significance of the three novel parameters in Model II and III with respect to that of Manger et al. (2012). We reject that each parameter is zero and also that the three of them are zero (see Table A.1).
A similar exercise was applied to period 2004-2012. Most effects have the same sign; we highlight only the differences with respect to prior period. First, in this period two variables that account for natural trade costs and market size effects are relevant to explain the PTA dynamics: same continent and same language. They both have positive signs, meaning that it is more probable that two countries would sign an agreement if they have the same language as well as if they belong to the same continent. The latter is only significant at 10% level in Model III, and is not significant in Model II.
With respect to the hierarchy effect of the PTAs, the signs of low-income countries reverse in terms of the prior period. In fact, all cross-income variables have positive signs, which would mean a higher activity rate with respect to the omitted variable (binary mean income to mean income matrix). In particular, low-income countries are notably more active in this period.
Second, bigger countries are more attractive in this period, opposite from observed in period 1994-2004. This effect should be read together with sim GDP which positive coefficient suggests that is more probable that countries sign agreement when they have similar size.
Finally, in Model III rivalry has the same sign. Given the lack of attention that the effect of trade specialization has had to understand the PTA dynamics, more study should be necessary to this effect in the future.
The joint significant test of the new variables in Model III gives us confidence on the relevance of including them into the model (see Table A.1).
6. Conclusions
Since the 80´s. and most notably since the middle of the 90´s. the PTA formation has grown steadily. Starting from a map of agreements where few countries were connected through regional patterns and ending up in a highly connected world. This keeps the regional pattern but other types of connection appear besides the regional ones.
The objective of this study was to analyze the dynamics of the linkages between countries through PTA using a simple theoretical framework based in an extension of Badlwin (1995). The main idea is that the creation of PTA is always a reciprocal exchange of market access. We test a model in which a country would prefer to sign PTA if it maximizes preferential market access and/or diminishes market discrimination. We were interested in including the interdependency between countries as an additional conditioning of the probability of signing a PTA. which can only be properly addressed using networking approaches. Third we test the role of natural costs of trade in determining the probability that two countries engage in agreements. Finally, we introduce as a determinant for PTA formation the role of trade specialization through rivalry of trade.
Our methodology follows Manger et al. (2012) approach which uses the modification for stochastic actor in non-directed network (SANO) as it is developed by Snijders and Steglich (2009). These models assume that at each time only one country has the possibility to create a new link with another country. The probability of change depends only on the current state of the network (follows a Markov process).
We used an array of PTA matrices in annual basis between 1994 and 2012. We split the data according to EU composition change in the period. These are discrete “pictures” of network evolution (dependent variable) used as inputs for SIENA algorithms. The independent variables consist of vector and matrixes aligned to theoretical arguments.
Results show that the network structural effects are in line with the hypothesis of domino effects in regional trade agreements: it is more probable that countries sign PTA with other countries with which they already have indirect ties. We show that when we consider the trade rivalry, this effect is reinforced. In effect, countries will more probably sign an agreement with a country where she is discriminated in sensitive items (those in which she specializes). From a different perspective but responding to the same finding, a country will give access to its market to a new country when it already gave access to her rival.
Similar to Manger et al. (2012) we found that poor countries had less chance to engage in PTA in the first period. But when we apply a similar model to the following period (2004-2012) the effect does no longer stand, as poor countries enter more actively the PTA network.
The future research will follow at least two lines. First, we will try incorporating the intensive margin of PTA formation into the analysis. Second, we will try to introduce some variables that account for bilateral relations, such as political or military alliances, which were not significant to explain this model but we expect that should be a determinant of PTA (in fact, Manger et al. (2012) find an effect for some of their specifications).
Baier, S. L. and Bergstrand, J. H. (2017). Data Construction Methodology. Unpublished manuscript. Kellog Institute.
Baier, S. L. and Bergstrand, J. H. (2004). Economic determinants of free trade agreements. Journal of International Economics, 64(1), 29-63.
Baier S. L., Bergstrand, J. H. and Mariutto, R. (2014). Economic Determinants of Free Trade Agreements Revisited: Distinguishing Sources of Interdependence. Review of International Economics, 22(1), 31-58.
Baldwin, R. E. (1995). A domino theory of regionalism. In Baldwin, R., Haaparanta, P. and Kiander, J. (Eds.), Expanding Membership of the European Union (pp. 25-53). Cambridge University Press.
Bergsten. C. F. (1996). Competitive liberalization and global free trade: A vision for the early 21st century. Peterson Institute for International Economics, Working Papers No. 96-15.
Grossman, G. M. and Helpman, E. (1992). Protection for sale. National Bureau of Economic Research, Working Paper No. 4149.
Grossman. G. M. and Helpman, E. (1995). The politics of free-trade agreements. The American Economic Review, 85(4), 667-690.
Hidalgo, C. A., Klinger, B., Barabási, A. L., Hausmann, R. (2007). The Product Space Conditions the Development of Nations. Science, 317(5837), 482-487.
Krugman, P. (1991). The move toward free trade zones. In Policy Implications of Trade and Currency Zones. A Symposium Sponsored by the Federal Reserve Bank of Kansas City at Jackson Hole. Wyoming, August 22-24. 7-42.
Krugman, P. (1992). Regionalism vs. multilateralism: Analytical notes. World Bank and CEPR Conference on New Dimensions in Regional Integration. Washington. DC.
Manger, M. S., Pickup, M. A. and Snijders T. A. B. (2012). A Hierarchy of Preferences: A Longitudinal Network Analysis Approach to PTA Formation. Journal of Conflict Resolution, 56(5), 853-878.
Manger, M. S. and Pickup, M. A. (2016). The Coevolution of Trade Agreement Networks and Democracy. Journal of Conflict Resolution, 60(1), 164-191.
Mansfield, E. D., Milner, H. V. and Rosendorff, B. P. (2002). Why democracies cooperate more: Electoral control and international trade agreements. International Organization, 56(3), 477-513.
Ripley, R. M., Snijders, T. A. B., Boda, Z., Voros, A. and Preciado, P. (2017). Manual RSiena. University of Oxford: Departament of Statititics. Nuffield College. University of Groningen: Departament of Sociology.
Snijders, T. A. B. (2001). The Statistical Evaluation of Social Network Dynamics. Sociological Methodology, 31(1), 361-95.
Snijders, T. A. B. and Steglich, C. E. G. (2009). Statistical Modeling of Dynamics of Non-directed Networks. Unpublished manuscript. University of Groningen: ICS/Department of Sociology and University of Oxford: Department of Statistics.
Snijders, T. A. B. and Pickup, M. (2016). Stochastic Actor-Oriented Models for Network Dynamics. In Victor, J. N., Montgomery, A. H. and Lubell, M. (Eds.). The Oxford Handbook of Political Networks (pp. 221-248). Oxford University Press.
8. Appendix A
9. Appendix B
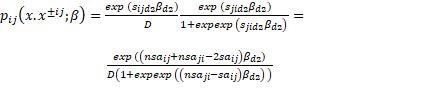
We are going to define the probabilities to have a new tie considering each partial effect. There are many other feasible combinations among identified effects.
Transitive ties (tt)
Measures the number of countries to which a country i is connected both directly and indirectly:
 (A.1)
(A.1)
where ![]()
![]() is the satisfaction of the network to country i
considering the state without any change. Probability j accept proposition is:
is the satisfaction of the network to country i
considering the state without any change. Probability j accept proposition is:
![]() (A.2)
(A.2)
where: ![]() =
=![]()
Then the probability to have an agreement considering both probabilities proposal and confirmation is:
![]() (A.3)
(A.3)
The probability to maintain the state of the network without any
additional tie is ![]() . In this case by assumption i and j need to be connected
so neither of both countries could be isolated. The odds ratio is:
. In this case by assumption i and j need to be connected
so neither of both countries could be isolated. The odds ratio is:
![]() (A.4)
(A.4)
The global odd when all the effects of having a PTA between countries i and j are considering is:
![]() (A.5)
(A.5)
where: ![]() ;
; ![]() .
.
Actor
pairs at distance two (![]()
The effect measures the numbers of countries that are at distance two. If there is more than an intermediate country then it is also counted again.
 (A.6)
(A.6)
where: ![]() the change in the number of agreements at distance two of country
i is the difference between not shared agreement (of j not i) with
shared agreements. The Probability that j accepts proposition is
the change in the number of agreements at distance two of country
i is the difference between not shared agreement (of j not i) with
shared agreements. The Probability that j accepts proposition is
![]() (A.7)
(A.7)
where: ![]() =
=![]()
![]() .
.
Then the probability to have an agreement considering both probabilities proposal and acceptation is:
 (A.8)
(A.8)
See that ![]() . The aggregate not sharing agreements (
. The aggregate not sharing agreements (![]() ) has a negative effect on the probability that the agreement was
done and the sharing agreements a positive effect. We assume that i is
not isolated country. The probability to maintain the state of the network
without any additional tie is
) has a negative effect on the probability that the agreement was
done and the sharing agreements a positive effect. We assume that i is
not isolated country. The probability to maintain the state of the network
without any additional tie is ![]() . Then the odds ratio is:
. Then the odds ratio is:
 (A.9)
(A.9)
Isolate effect
There are three
options. First. when country i is an isolated country and j is
connected (![]() ). The probability to maintain no connection by i (
). The probability to maintain no connection by i (![]() ) is
) is ![]() (
(![]() is the isolation parameter). In this particular case the odds
probability is:
is the isolation parameter). In this particular case the odds
probability is:
![]() (A.10)
(A.10)
As ![]() <0 then this odd with always be smaller than one. So to
consider the possibility to be connected for an isolated country is necessary
to include all the other effect not only the networks ones:
<0 then this odd with always be smaller than one. So to
consider the possibility to be connected for an isolated country is necessary
to include all the other effect not only the networks ones:
 (A.11)
Second when country i is connected and j is an isolated
country (![]() and
and ![]() ). The probability to do not have a tie with isolated j
when i is connected is
). The probability to do not have a tie with isolated j
when i is connected is ![]() . In this particular case the odds probability is:
. In this particular case the odds probability is:
 (A.12)
If both countries are isolated then the proposal country probability is:
 (A.13)
The partner probability of acceptation is:
![]() (A.14)
(A.14)
Then the probability to have an agreement considering both probabilities proposal and confirmation is:
![]() (A.15)
(A.15)
The probability to maintain the state of the network without any
additional tie is ![]() . Then the odds ratio is:
. Then the odds ratio is:
![]() (A.16)
(A.16)
The condition for isolate countries to connect each other is:
![]() (A.17)
(A.17)
Tables B2 and B3 summarize the definition and calculation of other two sets of co-variables introduced in the model.