![]() Revista de Economía y Estadística | Vol. LX | N° 1 | 2022 | pp. 11-53 | ISSN 0034-8066 | e-ISSN 2451-7321|
Revista de Economía y Estadística | Vol. LX | N° 1 | 2022 | pp. 11-53 | ISSN 0034-8066 | e-ISSN 2451-7321|
Instituto de Economía y Finanzas | Facultad de Ciencias Económicas | Universidad Nacional de Córdoba
http://www.revistas.unc.edu.ar/index.php/REyE
![]() Esta obra
está bajo una Licencia Creative Commons Atribución-No Comercial-Sin Derivar 4.0
Internacional
Esta obra
está bajo una Licencia Creative Commons Atribución-No Comercial-Sin Derivar 4.0
Internacional
Size and Position in Value Chains in Latin America with a Regional Perspective
Tamaño y posición en las cadenas de valor en América Latina con una perspectiva regional
Álvaro Lalanne
Universidad de Montevideo (Montevideo, Uruguay)
Abstract
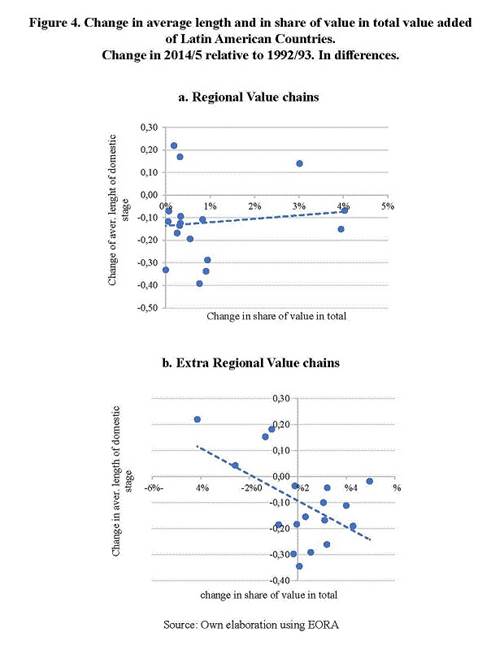
This article develops a framework that divides global value chains into regional and extra-regional and studies the participation of Latin American countries in the international fragmentation of production over 25 years of globalization. Measures of depth, position, and length are developed for each kind of value chain. Between 1990 and 2015 the engagement in activities related to international trade increased in every country in Latin America and the prevalent way of integration is in Extra-Regional Value Chains. While South America engages mostly in value chains as a source of value added transformed by others, Central America participates more as the end of chains and Mexico switched its position to a net forward position in regional value chains. Finally, the article examines the relationship between participation and length of the domestic segment of chains, finding that participation in Extra-Regional value chains is associated with the shortness of stages, while in regional integration this does not happen.
Keywords: Global Value Chains, Regional integration, Input Output, Forward and Backward Linkages
JEL Codes: E16; F14; F15.
Resumen
Este articulo desarrolla un marco para dividir a las cadenas de valor global en regionales y extrarregionales y estudia la participación de los países de América Latina en la fragmentación internacional de la producción en 25 años de globalización. Se desarrollan medidas de profundidad, posición y longitud para cada tipo de cadena de valor. Entre 1990 y 2015, la participación en actividades relacionadas con el comercio internacional se incrementó en todos los países de América Latina, y la forma prevalente de integración es en Cadenas de Valor Extrarregionales. Mientras América del Sur se involucra en cadenas de valor proveyendo valor agregado transformado por otros, América Central participa más en el final de las cadenas y México modificó su posición neta hacia ser más proveedor que usuario en las cadenas de valor regionales. Finalmente, el trabajo examina la relación entre la participación y la longitud del segmento doméstico de las cadenas de valor, encontrando que la profundización en la participación en cadenas extrarregionales está asociada a un acortamiento de las cadenas, mientras que eso no ocurre en las regionales.
Palabras Clave: Cadenas de valor mundiales, integración regional, insumo-producto, eslabonamientos hacia delante y hacia atrás.
Código JEL: E16; F14; F15.
Fecha de recepción: 29/05/2022. Fecha de aceptación: 13/09/2022
I. Introduction
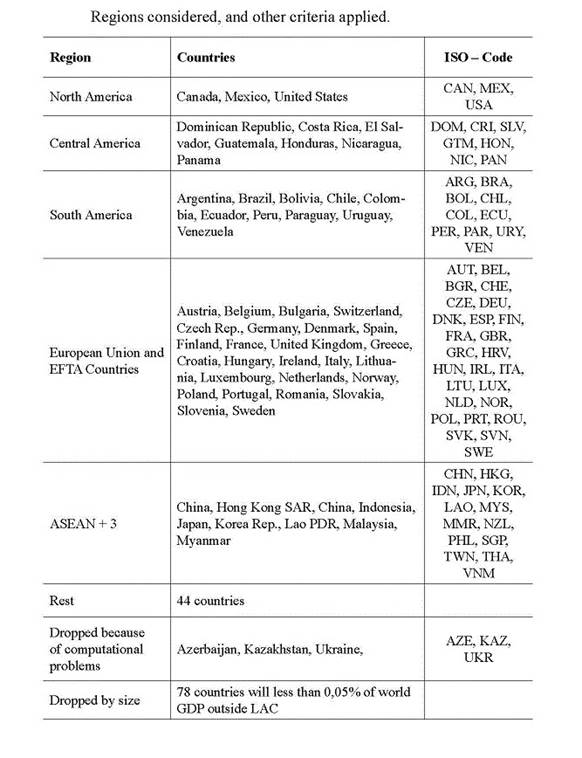
Nearby 1990 Latin American countries engaged in a process of openness of their economies and integration of their markets through multiple trade agreements signed with regional partners and also with non-Latin American countries. This strategy was very heterogeneous across the subcontinent. Mexico is engaged in the United States-Mexico-Canada Agreement (USMCA) which explains most of its trade. Central American countries have trade agreements with North American partners and Costa Rica also have treaties with many developed countries. South American countries are involved in an incomplete free trade zone (under many ALADI agreements) and there are big differences between Atlantic coastal countries, which belong to MERCOSUR and are relatively closed economies, and Pacific coastal ones, which have a strong network of trade agreements with developed and emerging countries (Moncarz et al. 2021).
Meanwhile, developments in infrastructure and information and communication technology and changes in the governance of global trade fed the second wave of globalization characterized by growing rates of international trade systematically higher than gross domestic product, giving rise to the “era of the global value chains (GVC)” (Antras and Chor 2021). Nowadays, several countries participate in the different stages of production of a good, generating a rise in the trade of intermediate goods and a dissociation between gross exports and the domestic value added included in them (Koopman et al., 2014). In this context, both regionalization and globalization changed the structure of supply and demand in Latin American countries.
One of the key facts of involvement in the international sharing of production is the position that industries in countries perform along the value chains. Since the seminal work of Hummels, Ishii, and Yi (2001), literature identified the forward and backward participation in value chains. Most complete accounting split of gross exports (Koopman, Wang, and Wei 2014; Borin and Mancini 2019) or value added (Wang et al. 2017b) focuses on identifying both types of participation. While forward participation focuses on the role of an industry as international supplier of intermediates, backward participation captures the role of industries as users of foreign value[1]
There is not a clear theoretical statement of what should be expected from these alternative ways to participate in value chains and their links with economic development (Antras and Chor 2021). Nevertheless, some works find some evidence on GVC backward participation and productivity (Los and Timmer 2020) and other aspects of development (World Bank 2019). Also, industries exporting upstream tend to have more output volatility (Olabisi 2020).
Even though there have been early noted that international supply chains tend to be more regional than global (Johnson and Noguera 2012), only few articles build a framework for separate identification of both kinds of fragmentation. Antràs and de Gortari (2020) develop a Ricardian model derived from Eaton and Kortum (2002) finding that downstream participation in global value chains tends to be more elastic to changes in trade costs. They model the geography of value chains finding that, departing from high trade costs, both regional and global value chains rise relative to domestic chains, but if trade cost continues declining only global value chains re- mains, because comparative advantage (fueling global sourcing) prevails over proximity.
Intercountry input-output tables link sectors of different countries and enable a complete evaluation of relationships between final demand, intermediate -domestic and foreign-demand and the value added. In recent years there have been several projects of integration of world input-output tables (WIOT)[2]. Using these data, economic literature developed a set of measures to characterize the size, position, or length of GVCs.
Most of these measures are conceived for GVC and so the regional character of value chains, noted early by Johnson and Noguera (2012), is less frequently studied within a comprehensive framework. Many reasons can justify the inclusion of a regional dimension in measures. First, the regional integration approach needs a benchmark to contrast results, and domestic and extra-regional results are the best candidates. Also, trade policy with regional partners has its issues not always shared with global -or multilateral- trade policy. Finally, is well documented that globalization is a result of the offshoring of firms and frequently this strategy starts with nearshoring and then expands worldwide. While regional integration studies using input-output tables have a long tradition in regional economics, there seems to be a certain divorce in the toolkits used by regional economics and those used by international economics.
While participation in GVC of some Latin American countries like Mexico have been widely studied (De La Cruz et al. 2011; De Gortari 2019) as an example of vertical regional sharing, there is still missing a comprehensive approach on the evolution and kind of participation in value chains. One of the main difficulties is that, in contrast to the situation of European countries, there are few Latin American countries in most used WIOTs.
Blyde, Volpe Martincus, and Molina (2014) uses input-output tables of the GTAP project to estimate participation in value chains of Latin American for a given year. The Economic Commission of Latin America and The Caribbean (ECLAC) launched Regional Input Output Tables for 18 Latin American Countries (ECLAC, 2016) that have been used in research that focuses on total trade (Banacloche, Cadarso, and Monsalve, 2020), regional trade (Amar and Torchinsky Landau, 2019; Lalanne, 2021) or both (Durán Lima and Banacloche, 2021). While these articles are useful for depicting the main characteristics of regional trade of intermediates, they have limitations derived from the use of a Regional Input Output Table instead of a WIOT.
The main limitation of regional tables is that the chains, defined form value added to final demand, are only fully depicted when all value is added in the countries belonging to the region. Exports to extra-regional countries are treated as is they were all in final products and imports of intermediates are treated as if they were all foreign value added. This limitation is especially important in measures of length and position in chains, where value-added and final demand are key concepts. A second weakness of regional tables is that they do not enable comparison between regional and global participation in value chains. Finally, at least until now, the time span of regional tables in Latin America is reduced, they cover Latin America for 2005[3], 2011 and 2014. The interesting period from 1990 to 2003 remains uncovered. Note that this includes the beginning of the impulse of “open regionalism”, the crisis of Tequila in 1994 and Argentina in 2001 and the early stages of the rise of China as a global producer.
Literature on macro measures of participation in GVC from WIOTs can be divided in literature on value added in final goods, decomposition of gross exports, and positioning in GVCs (Antras and Chor 2021). While Durán Lima and Banacloche (2021) display and present measures of the first and second type, Amar and Torchinsky Landau (2019) and Lalanne (2021) focus on the decomposition of gross exports. Nevertheless, there is still lacking a description of Latin America from the perspective of position and length of chains[4].
This article adapts global measures developed by Wang et al. (2017a,b) to divide total activity into domestic, regional, and extra-regional. By doing so, it identifies exclusively domestic, regional, or extra-regional value chains and a residual category comprising mixed value chains. Using the EORA database (Lenzen et al., 2013), I depict the evolution of value added in Latin American countries according to the participation in each type of trade in 1990-2015. Then, this article presents fully integrated measures of participation, position and length of value chains over 25 years of globalization and regional integration. The framework allows comparison with performance in other regions of reference, such as Europe and Asia.
Wang et al. (2017b) develop a measure of participation in global value chains, arising from the decomposition of total final goods and services production, splitting the value added in domestic stages from the foreign value added and also considering the place of final consumption. According to Wang et al. (2017b), total production can be split into pure domestic value added included in domestic consumed production, pure domestic value added included in final goods and services exported and global value chain production, characterized by international trade of intermediates and so vertical specialization.
Wang et al. (2017a) defines new measures of length of production and upstreamness. These measures rely conceptually on the existing literature (Antràs and Chor, 2013; Antràs et al., 2012; Fally, 2012), but they are applied to WIOT instead of local matrices. In this sense, their work is close to Antràs and Chor (2018) and Miller and Temurshoev (2017), with the difference that their measures are defined as ratios of value added instead of ratios of production. Also, they apply the length of production in each of the terms defined in Wang et al. (2017b), leading to a new set of measures of GVC participation that considers both domestic and international value chains.
Both Wang et al. (2017b,a) measures of participation in GVC and length are used in the 2017, 2019 and 2021 Global Value Chain Development Report (WTO, 2017, 2021). These two contributions help us to understand the evolution of depth and length of GVC participation. They show how GVC activities gained participation in total value-added and raised their length until the 2008-09 crises and then they stopped their pace and slightly shortened.
These measures rely on a parsimonious decomposition of value added included in the output according to two perspectives. First, for the exports of intermediates, they decompose the demand, that is, the use that is made in a country or sector of destination. Second, they decompose the supply, that is, the source of value added included in the production. In all cases, both the final demand-the destination- and the origin of value –the supply- is decomposed according to domestic and foreign.
This article contributes to the literature of measuring regional integration adapting a framework conceived for global production. In this sense, it relates to Antràs and de Gortari (2020) measure of regional value chains in North America, Fan et al. (2019) measure of regionalization in China or Bolea et al. (2019) measure of different patterns of value chains in Europe. Also based on Borin and Mancini (2019) measure of participation in Global Value Chains, World Bank’s Global Value Chains Report 2020 also applies measures of regionalization of international value chains (World Bank, 2019). Furthermore, this article reveals some aspects not showed before on previous analysis on Latin American fragmentation of supply chains. Particularly, it describes the length of Latin American regional and extra regional value chains.
This paper includes, in addition to this introduction, three sections. Section II introduces the methodological scheme built in previous work and develops the adaptation of these measures to divide trade in traditional and value chains trade, defining regional, extra regional and mixed value chains participation. Section III shows the results of the application for Latin America and discusses some features of the regional value chains and Section IV draws some conclusions.
II. Measures of depth, length, and position in Domestic, Regional, Extra Regional, and Mixed Value Chains
II.a General notation and definitions
Intercountry input-output tables organize the world supply and demand according to a structure akin to depicted in Table 1. To apply the algebraic decomposition defined in this article, regional countries must be arranged in the first rows and columns and extra-regional are placed subsequently. Countries s and t belong to region G {s, tÎG} and f and k are countries of the rest of world H { f, kÏG; f, kÎH}. Then, there are G + H countries in the table.
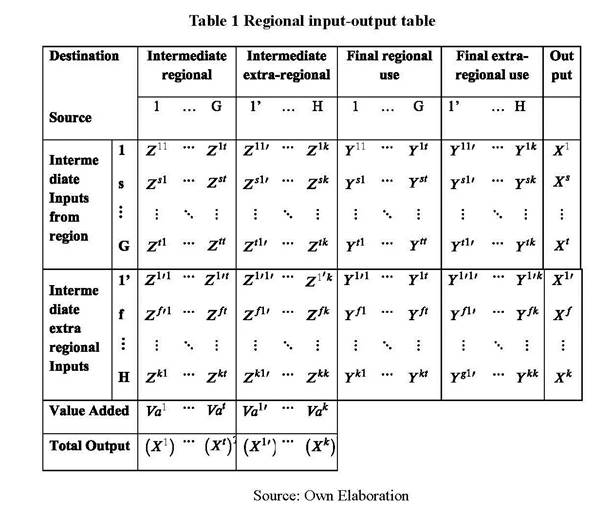
Where Zst is an N×N matrix of intermediate inputs produced in country s and used in country t, Yst is an N×1 vector of final goods produced in country s and consumed in country t, Xs is an N×1 vector of output of country s and Vas is a 1×N vector of direct value added in country s. T is the transpose operator. Terms labeled with k instead of t have analogous interpretations.
It is useful to aggregate every destination of final demand faced by regional countries according to the sourcing country and sector, but distinguishing demand in domestic (Y D)[5] regional demand of regional products (excluding domestic; Y R) and extra-regional final demand sourced by regional countries (Y F). Also, all demand (domestic, regional, and extra-regional) faced by extra-regional countries is aggregated in Y H. All these are N(G+H)×1 vectors and the sum equals to total final demand.
Y = Y D + Y R + Y F + Y H (1)
In a general notation, final demand Y, and production X can be expressed as N(G+H)×1 vectors, Z is an N(G+H)×N(G+H) matrix and Va is a 1×N(G+H) vector.
The Leontief matrix ![]() enables the
usual notation in
in-
put-output analysis. The operator (^) indicates that the vector is expressed as a diagonal
matrix. The usual segmentation of production is:
enables the
usual notation in
in-
put-output analysis. The operator (^) indicates that the vector is expressed as a diagonal
matrix. The usual segmentation of production is:
X = AX + Y (2)
Each Asr is an N×N matrix containing the ratios of the utilization of origin s in the production of country r. In the main diagonal s=r and correspond to domestic intermediate supply, whereas when s≠r is the case of international trade of intermediates.
The International Leontief inverse matrix is defined as:
B = (I-A)-1 (3)
Each submatrix Bsr is the total output necessary in each n sector of the country s to fulfill one additional unit of final demand in each n sector of r (Bsf has the same interpretation).
From the column perspective, the output is the result of the com- bination of intermediate inputs plus the value-added (Va). This equation illustrates the Leontief production function:
![]() (4)
(4)
Where V is a 1xN(G+H) row vector of ratios of value added to product and u
is a 1xN(G+H) vector of
ones. Posmultiplying by ![]() the expression gives rise to the decomposition formula
for production:
the expression gives rise to the decomposition formula
for production:
![]() (5)
(5)
Final demand or total output can be split using (5)
according to the country and sector of origin of value.![]() has some useful properties. Postmultiplied by a diagonal matrix of final
demand it leads to complete decomposition of value added included in it. On the
direction of any column, the sectoral
output is divided according to the country/sector of origin of the value, and the total sum of the column equals the final demand of each sector.
On the direction of rows,
the value added of a country/sector is divided according to the country/sector of final
use, and the total sum equals the total value added of this country/sector[6].
has some useful properties. Postmultiplied by a diagonal matrix of final
demand it leads to complete decomposition of value added included in it. On the
direction of any column, the sectoral
output is divided according to the country/sector of origin of the value, and the total sum of the column equals the final demand of each sector.
On the direction of rows,
the value added of a country/sector is divided according to the country/sector of final
use, and the total sum equals the total value added of this country/sector[6].
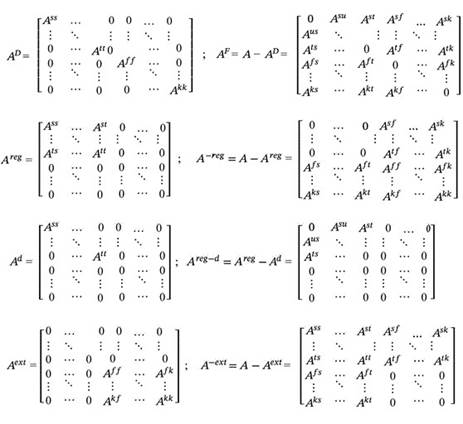
Wang et al. (2017a) split total requirements (A) in domestic (AD) and international (AF). Then AFX represent the international trade in inter- mediates. In this paper will be necessary further decompositions of A. The key technical step to obtain domestic, regional, and extra-regional results is defining auxiliary matrices that are in fact submatrices of A and their complements. Appendix A shows the definition of AD, Ad, Areg and Aext and their complements AF, A-reg, Areg-d and A-ext used in the method. AD is a block diagonal matrix containing domestic requirements and zeros otherwise, Ad contains domestic requirements only for regional countries, Areg contains all requirements of regional countries ad zeros otherwise and Aext contains requirements only with origin and destination between non-regional countries and zeros otherwise.
It should be defined also the Leontief Inverses matrix of these partitions of A.
L' = (I − AD )−1 L = (I− Ad )−1
Breg = (I− Areg )−1 Bext = (I− Aext )−1
Given that AD, Ad, Areg and Aext are subparts of A, then L', L ,Breg and Bext are a smaller amount of B.
The hypothetical extraction method followed by an important strand of the literature in GVC (Los, Timmer, and de Vries (2016), Los and Timmer (2020), Miroudot and Ye (2018), Johnson (2018)) apply an equivalency between Leontief inverse matrix and some partition of it. Following this literature and Borin and Mancini (2019) a set of relationships will be defined. See Wang et al. (2017a) for a demonstration of (6) and Appendix A for a demonstration of (7), (8), and (9).
As long as A = AD + AF, it can be shown that:
B = L' + L'AF B (6)
As long as A=Areg + A-reg , it can be shown that:
B = Breg + Breg A-reg B (7)
Analogously, given that Areg =Ad +Areg-d:
Breg =L + L Areg-dBreg (8)
Finally, as long as A=Aext + A−ext, it can be shown that:
B = Bext +Bext A-ext B (9)
II. Measuring the participation in Global Value Chains
At global value, total value-added equals total final demand. The link between value added in the sector i of country s and the final demand of sector j in country r is represented by the N(G+H)xN(G+H) matrix V̂ BŶ .
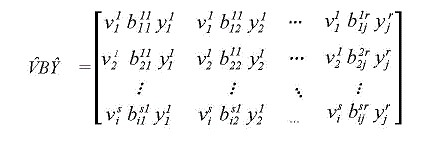
The generic term vs bsryr represents the total direct and indirect value added sourced in sector i of country s (vi) included in final goods production of sector j
i ij j
in country r (yjr).
Note that V̂ BŶ show the splitting of value-added contribution to final goods production irrespective of where they are consumed, as also a strand of literature does (Los, Timmer, and de Vries 2016; Timmer et al. 2015; Los and Timmer 2020). Johnston (2018) labels this option as the “GVC Income” view because it traces the value added embodied in final goods by source country along the value chain. Los and Timmer (2018) also use this view to define their VAX_P concept, that is the value added exported for final production[7].
V̂ BŶ enables two perspectives of value chain analysis. In the row perspective, the value added sourced in a country sector is used in the pro- duction of final goods of other sectors and countries. This view originates in the sourcing of value in some country sector and ends its circulation (as intermediate) when is included in a final product. This is the forward perspective, and it goes from the sourcing sector to final use. In the direction of columns, the production of final goods is divided according to the country sector or origin of value. This view goes from the final production and tracks backward where the value was included. This is the backward perspective. The forward perspective is useful to characterize the circulation of value that a country has while the backward perspective is more suited to analyze the sourcing function of production. In the following sections, I will get some measures according to either one or the other perspective. It is important to remark that, if V̂ BŶ is used as the starting point, always one of the two perspectives must be chosen.
III.a The forward perspective of value chains: Following the use of domestic value added
Applying (7) in V̂ BŶ, we get:
V̂ BŶ = V̂ Breg Ŷ +V̂ Breg A−reg BŶ (10)
Substituting Breg in (10) using (8) we get:
V̂ BŶ = V̂ LŶ + V̂ LAreg−d Breg Ŷ + V̂ LA−reg BŶ +V̂ LAreg−d Breg A−regŶ
Also, B in the third term can be decomposed using (9).
V̂ BŶ =V̂ LŶ + V̂ LAreg−d Breg Ŷ + V̂ LA−reg Bext Ŷ + V̂ LA−reg Bext A−extBŶ
+ V̂ LAreg−d Breg A−reg BŶ
First-term accounts for domestic value added included in final goods without border crossing of intermediates. It can be divided according to the destination of final goods, using Eq. (1).
V̂ BŶ = V̂ LŶD + V̂ LŶR + V̂ LŶF + V̂ LŶH
+V̂ LAreg−d Breg Ŷ + V̂ LA−reg Bext Ŷ
+ V̂ LA−reg Bext A−ext BŶ + V̂ LAreg−d Breg A−reg BY (11)
Eq. (11) is a generalization of Wang et al (2017a) to the case of region- al and extra-regional countries[8]. Each term of (11) is an N(G+H)×N(G+H) matrix. Pos-multiplying each term by an N(G+H)×1 vector of ones (uT) we get accounting segregation of value added of each country-sector according to their participation in value chains and international trade. This split only holds for the first NG rows that represent the countries of the region. The NH following rows do not have interest from the perspective of regional value added.
V̂ BŶuT = V̂ BY = Va = V̂ LYD + V̂ LYR +V̂ LYF+ V̂ LAreg−d B−reg Y + V̂ LA−reg Bext Y
+ V̂ LA−reg Bext A−ext BY + V̂ LAreg−d Breg A−reg BY (12)
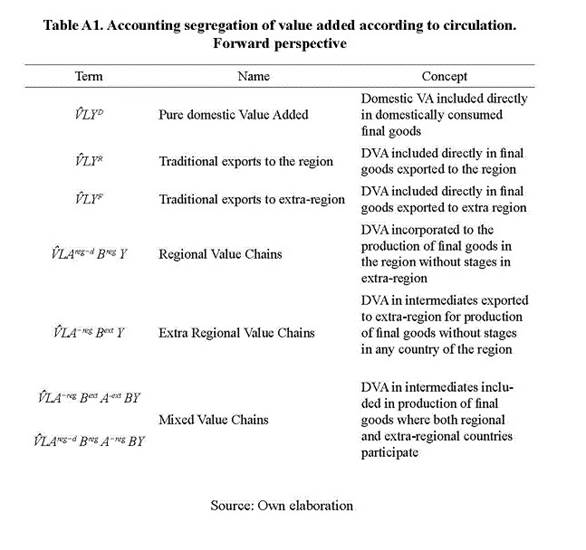
Now, instead of matrices, we get seven vectors. The first NG rows are each sector of the G regional countries. Each flow is presented in table A1 in Appendix A.
The first term of (12) is the pure domestic value added included in local production for domestic demand. This value added does not cross any border. This term represents the activity of a country not related to international trade. Except for some small countries, this term accounts for most of the activity of a country. Analogously, V̂ LŶ R is pure domestic value added in final goods exports to a regional partner. This value added only crosses borders once. The third term is analogous to the second but for extra-regional instead of regional consumption. The sum of the first, second, and third terms of Eq (12) is the value added of a country directly included in the production of final goods without crossing any border. Note that, as long as the production of final goods in a country can use foreign inputs, this value is lower than final goods production itself.
The rest of the terms (4 to 7) of Eq (12) is value added included in the export of intermediates and so involve any kind of Global Value Chains trade. The fourth term is the value added included in final goods produced in a regional country without any further stage in extra zone. It is labeled as Regional Value Chains (RVC) because it entails regional trade of intermediates but, at least from the perspective of the sourcing country s, it does not include extra-regional stages. RVC represents two or more regional countries sharing a chain of production. The fifth term is the value added in intermediates that are exported to extra-regional countries and transformed there into final goods without further participation of any regional country (including s). It is labeled as EVC in opposition to RVC and it represents the integration of a country with extra-regional production instead of regional integration. The final two terms, sixth and seventh, are the more complex and less sizable. They account for value added in s that is exported as intermediate and included in chains that involve both regional and extra-regional countries. As will be noted later, these chains have a minimum length of three, because it intervenes in at least one stage in the domestic country, one stage in the regional country, and one stage in the extra-regional country. The difference between terms sixth and seventh is the order of the operation, while in the former the order of value-added flow is domestic-extra region- al-regional in the latter the sequence is domestic-regional-extra regional. They are labeled as Mixed Value Chains.
II.b The backward perspective of value chains: Tracking the origin of value
Summing V̂ BŶ across columns leads to the total final production of each country sector. After some manipulation analogous to the forward perspective[9], we get a disaggregation of final demand according to the origin of value.
uV̂ BŶ = VBŶ = Y T = VLŶ D +VLŶ R + VLŶ F
+ VBreg Areg-d LŶ +VBext A−reg LŶ
+VBA−ext Bext A−reg LŶ + VBA−reg Breg Areg−d LŶ (13)
The first, second, and third terms account for the domestic value added directly included in the country of reference in domestic, regional, and extra-regional final demand respectively. The fourth term is the regional value added included in final production without any stage outside the region. That is, the regional value added that after some regional circulation is used by the country of reference in its production of final products. It represents the backward view of regional integration in Value Chains. The fifth term is the extra-regional value added used in domestic final production without any stage in the rest of the region. It represents the backward view of participation in Extra regional Value Chains, as defined before. The sixth and seventh terms are both mixed value chains from a backward perspective.
II.c. Single and complex value chains and links with other measures of participation in value chains
At this point, it is useful to point out that RVC and EVC include flows of intermediates that cross borders at least one time. This means that includes intermediates imported by a country that are not further exported but simply used in domestic production. The multiple border crossing of intermediates is one of the most salient features of globalization and is be- hind the increasing divorce between statistics of trade and level of activity (Koopman, Wang, and Wei 2014). Some recognized measures define valuechain participation as the share of value added in exports that cross borders twice or more (Borin and Mancini 2019).
To capture these flows Wang et al. (2017a) split the global value chains term according to single and complex value chains, both for forward and backward perspectives. Appendix C shows an adaptation of these measures to the scheme developed here, a comparison with Borin and Mancini's (2019) measures, and the empirical results of this exercise. An analysis of both kinds of measures of participation is also included in the 2021 WTO Report on Global Value Chains (Xing, Gentile, and Dollar 2021).
II.d. Measuring the length and the position
Fally (2012), Antràs et al. (2012), and Antràs and Chor (2013) introduced definitions of product length, upstreamness, and dowstreamness in global value chains, using the concept of “Average Propagation Length” defined in Bosma, Romero Luna, and Dietzenbacher (2005). In doing so, they used the United States input-output table and did some adjustments to fit with international trade. Later, Antràs and Chor (2018) and Miller and Temurshoev (2017) used these definitions to characterize countries and sectors with World Input-Output Tables. While both articles find a strong correlation between upstreamness and downstreamness, Miller and Temurshoev (2017) show that these measures can be regarded as alternative row and column sums of the same set of information, and define the Output Upstreamness and Input Downstreamness to characterize sector and country position in global value chains.
This literature measures output upstreamness, from output to final demand, as the average number of times that the value is counted until it is included in a final good. Alternatively, define the input downstreamness as the average number of times that the value added has been counted until it is included in the output.
While using the same concepts behind previous definitions of upstreamness, downstreamness, and length of production, Wang et al. (2017b) point out that those measures are inconsistent because they start from the gross output and have been defined as gross measures, whereas, if defined from primary factors to the production of final goods, upstreamness and downstreamness of a particular country/sector in a global production network are the two faces of the same coin. Wang et al. (2017b) state that both concepts are useful only concerning production length, and so they measure the relative distance of a particular production stage (country – sector) to the origin of value and the final production.
In a matrix notation, Wang et al. (2017b) define the average length of a chain as the element-wise ratio of two matrices:
PL = V̂ BBŶ / V̂ BŶ (14)
The denominator is a matrix equivalent to ![]() that is, the total value added from a country
sector included in final production from another country sector.
that is, the total value added from a country
sector included in final production from another country sector.
The numerator is, like in Antràs and Chor (2018), the average number of times that the value-added originated in a sector of a country is counted as output in final production from another country sector. PL represents the weighted average of times that the value added of a country´s sector is counted as output in final production, and the weights are the amount added itself.
As mentioned earlier, the average length is useful if defined as a row or column sum. As in previous measures (Antràs et al. 2012; Miller and Temurshoev 2017), the forward perspective or producer’s perspective of length is the row sum of the Ghosh inverse Matrix (H). This yields an N(G+H)×1 vector.
PLv = V̂ BBŶuT / V̂ BŶuT = V̂ BBY / V̂ BY =HuT (15)
Analogously, the backward perspective or user’s perspective, of length is the column sum of the Leontief inverse Matrix. This yields a 1×N(G+H) vector.
PLy = uV̂ BBŶ / uV̂ BŶ = VBBŶ / VBŶ = uB (16)
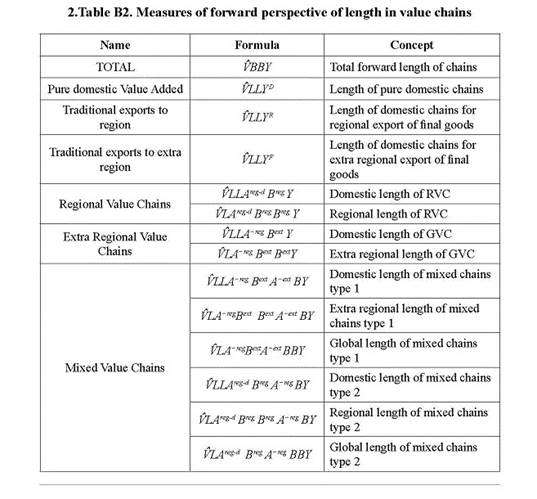
While the forward-perspective traces the average number of times that value added of sector i of country s is counted in production until it is transformed into final demand in sector j of country r, the backward perspective traces the average number of stages that final production of sector i in country s must undergo from primary inputs. Wang et al. (2017b) apply the measures to the decomposition stated in Wang et al. (2017a), instead of doing it for the general set of information. By doing so, they can isolate the length of each specific kind of chain: there is a length for pure domestic chains, a length for traditional trade chains, and a length for global value chains. They define a length of chains for each of these three terms of their decomposition of V̂ BŶ.
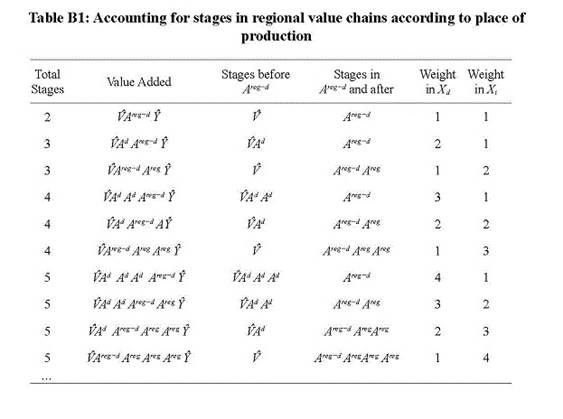
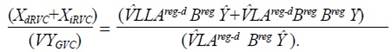
Following Wang et al. (2017b) method, I divide the forward perspective of the total length of chains in the length of each term of Eq (12). By doing so, it could be identified the length of chains according to the kind of integration being considered. Each term of the regional or extra-regional value chain can be divided into two linkages: those taking place in the sourcing country and those taking place in the regional / extra-regional partner. The usefulness of this division is not only conceptual but also operative. Without dividing RVC or GVC total sharing into the stages that ensued before the first border crossing and the rest, it is not possible to get a formula for the accounting.
Appendix C shows the formula of forward-perspective length of chains for each term of Eq (12) and demonstrates the results. Equation (16) sets that there can be also a backward perspective of the length of chains, considering the number of stages that value added can have before being used as final goods by country of reference. Instead of using Eq (12), this perspective must use the backward-looking decomposition of Eq (13). The method and the algebra are like the forward-perspective case and so they will be omitted.
III. Measuring regional and global integration in value chains in Latin America
The data used is extracted from EORA- UNTACD database and covers in principle 189 countries and 26 sectors for the period 1990-2015. Data consists of a matrix of local and international intermediate transactions, local and international final demand, and value added (Lenzen et al. 2013). Despite having less disaggregation than other databases such as WIOD, their extensive period and availability of data for every Latin American country make it a database useful for studies for developing regions.
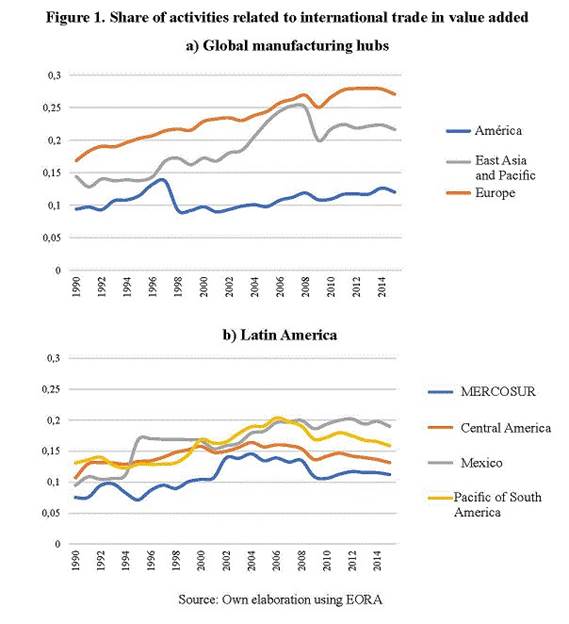
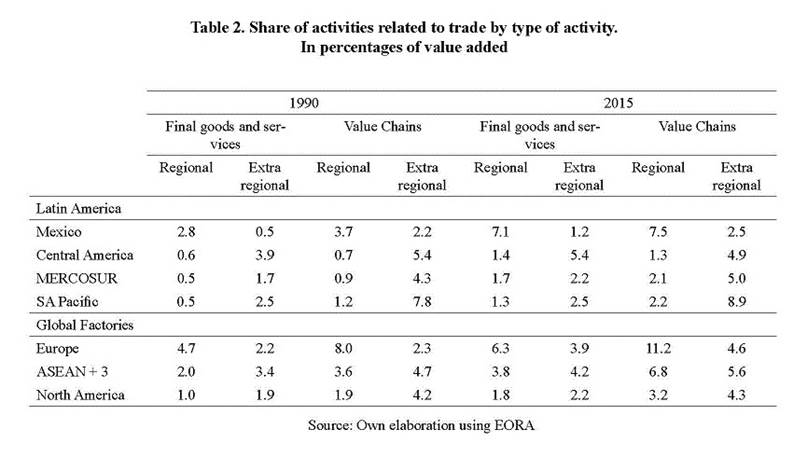
III.a. The overall evolution of the international trade-related activity
Based on Eq (12), Figure 1 and Table 2 shows the evolution of value added in activities related to international trade in the period from 1990 to 2015 for selected regions. Table D1 in Appendix shows the disaggregation of Table 2 for each Latin American country in the sample. The overall picture of the figure and tables shows some salient features that cannot be retrieved form databases with less time and country coverage. First, despite being a minor share of economic activity of countries, the value related to international