Risk-premium φ can be expected to be positively related
to price variability faced by producers: as discussed below, Argentine farmers
have not only faced unfavorable input/output price ratios, but have
also experienced significant between-year variability in these prices. “Noise”
in price signals can be expected to dampen the impact that these signals have
on necessary farmer adaptation, either because of risk-premiums associated with
input use, or simply due to the information-processing limitations of
decision-makers.
Identifying
the impact of risk on producer demand is a complex endeavor: even a
sophisticated (and costly) approach based on deriving utility functions is of
questionable value due to the inherently normative – and not necessarily
descriptive - nature of this approach. Indeed, as pointed out be cognitive
psychologists (see, e.g. Kahneman and Tversky, 1979), normative models do not
necessarily represent actual decision-making processes.
But
even ignoring the problem of risk and risk attitudes, an additional issue
merits attention: how agricultural producers adapt to both new technical
opportunities (“technical change”) as well as to shifting relative price
ratios.
II.1
Technical change and input productivity
Technical
change is defined as an increase in output resulting from a given input bundle, or alternatively, a
reduction in input needed for a given output.
Factor prices influence the direction of technical change: in agriculture “land-saving” and
“labor-saving” technical change has been identified, respectively, with land-scarce
and labor-scarce agricultural economies (Hayami and Ruttan, 1985). If technical
change can be assumed “neutral”, in the sense of leaving substitution rates among inputs
unchanged, a Cobb-Douglas production technology can be used to represent
production possibilities. Here technical change
is modelled in a shift
through time in the parameter
A(.).
 [1]
[1]
Under
this model, not only output will increase for every input vector, but input marginal
productivity as well. Marginal productivity, in effect, is directly proportional – for a given input level of X2 - to A(t).
MPi = αA(t)Y/Xi
[2]
Which results in input demand:
Xi*(w,p) = [(pA(t) X2β) /w]1/(1-α) [3]
Input demand schedule is thus a function of technical change incorporated into the production process.
II.2 Producer learning
and technology adoption
T.W.
Schultz (1975) distinguishes between “static” and ‘dynamic” conditions of the
economic environment. In the former, adaptation is unnecessary: “trial and
error” methods have been used over the years and have resulted in “optimum”
levels of input use and output patterns. The “poor but efficient” hypothesis results:
in less developed economies, slow or no introduction of new technologies
results in absence of opportunities for re- source re allocation (Schultz,
1964). In contrast with the above, returns to the “ability to deal with
disequilibrium” are high in economies where a steady inflow of new technologies
opens up opportunities for change. Huffman (1977) estimates the relationship
between farmer education and agricultural extension services on adjustment in
fertilizer use to changing relative prices and crop fertilizer response.
Huffman reports a significant relationship between these two variables on the
observed adjustment process (for a survey on the impacts of human capital on
adoption of technologies see Huffman, 2000).
Classical
papers focused on fertilizer demand include Griliches (1958 and 1959) and Heady
and Yeh (1959). Estimated demand elasticities range from -0.5 in the short-run,
to -2.0 in the long run. These studies highlight the importance of data
availability for the study of input demand. The approach used in this paper
(Section IV below) is presented as a first approximation to the determinants of
fertilizer demand based on limited data available at this time.
The
relative role of prices and non-price factors in explaining producer decisions
has been subject to debate. A frequently-cited case is the exchange between Zvi Griliches (an
economist) and Everett Rogers (sociologist). Focus here was on the determinants
of the adoption of corn hybrid seeds in the U.S.A. Griliches emphasized profit opportunities as the main factor explaining adoption, while Rogers highlighted
aspects such as knowledge diffusion,
community networks and related aspects (Griliches, 1962, Rogers y Havens, 1962).
Although apparent conflict exists between these two visions, points in common emerge: as pointed out by Griliches, many of the factors considered important by sociologists (e.g. learning processes, information channels,
community leadership) are themselves a response to changing economic
opportunities.
Production
processes generate information, and this information is used to update beliefs. For example, a farmer adopts a new technology on a
trial basis or changes the level used of a given input. Prior to observing results, the farmer forms expectations on
output resulting from this technology. A-posteriori, new results emerge. An
adaptive behavior to changing opportunities
is to be expected. The efficiency with which this adaptation occurs is a function of formal and
informal human capital of the relevant decision-maker.
Summarizing
the above: the quantity demanded of an input results from an optimization process where producers attempt to equate
perceived input marginal productivity
with the relevant price ratio. But perceived productivity may be quite
different from the objective productivity that can be expected on a given plot of land. Change
over time in production possibilities, producer knowledge about these, price
changes and variability in production
conditions result in the “profit maximizing” input level being an elusive target. Further, risk attitudes
introduce additional complications: as (unobserved)
utility, and not profits, may be the relevant objective function to be taken into account (Andeerson,
Dillon and Hardaker, 1977). Issues such as these most probably play an important
role in cases such as analyzed here where in a three-decade period where
use of an input (fertilizer) evolved from practically less than half a million
to five million tons a year.
III.
The fertilizer
input in Argentine agriculture
III.a Overview
Crop
production in Argentina dates from the second half of the XIX century.
In the early 1900’s some 4 million
hectares were planted,
increasing to 20 million by the 1930’s. As a result of both of policies which resulted in distortion of incentives, as well as neglect of agricultural research
and the development of new
technologies, planted area remained unchanged for half a century. Only in early 1980s area started to steadily
grow, reaching in 2020 38 million hectares
in extensive grain production (Reca, 2016).
The rate of introduction of new technologies picked up in the early 1960’s, after the creation of INTA,
the national institute for agricultural research.
Modern (“mexican”) wheat varieties, hybrid sunflower, new corn hybrids and improved crop management
practices were adopted. In this period,
however, the very low level of fertilizer used is an anomaly of Argentine
agriculture with respect to other important grain producers. Indeed, in the mid 1970s, most of the national
demand for fertilizers (some 70.000 tons
annually) was accounted for by fruit and horticultural crops (which represented less than 10 percent of the value of output),
and practically none by
the important grain producing sector. Fertilizer
use increased steadily during the 1990’s, averaging
some 500.000 tons in the 1990/94 period,
and 4.7 million tons three decades later (Figure 1).
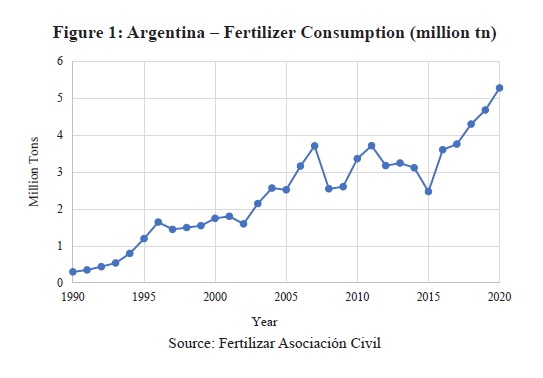
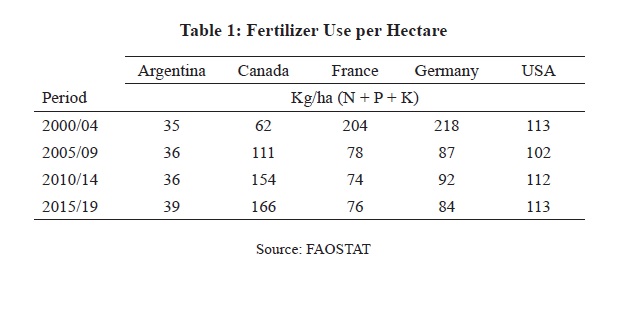
Despite
the substantial increase that has occurred in the last three decades,
per-hectare fertilizer levels in Argentina are still ¼ to ½ of that in other important
temperate-climate producers such as the U.S, Canada, France and Germany (Table 1).
Up
to the 1960’s low fertilizer use can be explained by depressed crop prices (result of export taxes and
exchange rate controls), high fertilizer prices (result of import restrictions)
as well as limited availability of technologies
complementary with the fertilizer input (in particular – but not only - high fertilizer response seeds).
The steady flow of new technologies occurring
in the 1970’s set the stage for increased adoption of fertilizers. However unfavorable relative price ratios
hampered this process. Cirio, Danelotti and White (1981) report that in the 1970’s, in Argentina 6-10 kg
of wheat was necessary to purchase
1 kg of fertilizer (elementary nitrogen), while in Australia, the U.S and France the relative price was one-third
to less than one-half of the above. Price differentials are thus a
strong candidate explaining low fertilizer use.
The
long long-term trend of real fertilizer prices faced by Argentine producers
(Figure 2) shows a decline through time. However, this trend obscures variability in different periods.
During the 1970’s prices, though lower
than those of the previous decade, were still high by international standards: as shown in Figure 2, during
the 1980s and 1990s, approximately 2
kg of wheat were necessary to purchase a kg on nitrogen in the U.S.; in Argentina, relevant price ratios varied
from 4 to more than 6: a two or three- fold
increase. Elimination of barriers to trade, and exchange rate controls resulted during the 1990’s in relative
prices converging – albeit slowly - to international levels.
After 2001 re-imposition of export taxes for agricultural commodities drove the relative price upward, although
not to the level of the 1980’s and (particularly) the 1970’s. A
brief period of market liberalization resulted
(2016/19) in a new period of relative price decline. However, prices were still substantially (+ 60 %) above those faced by U.S. producers.
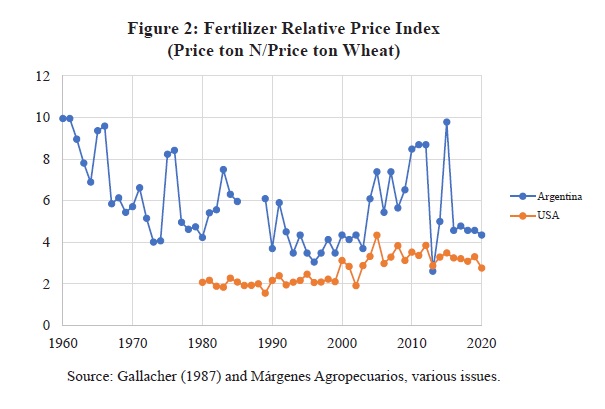
Argentine
producers not only faced substantially higher input/output price ratios than those of U.S.
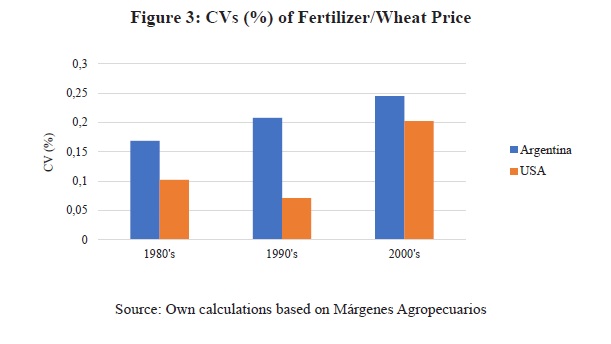
producers, but also higher variability (as measured by CV’s) as well: as shown
in Figure 3, fertilizer/wheat price CVs were, during the 1980’s and 1990s, more than double of those in the U.S. As
mentioned previously, price variability not only increases risk premium (or “required rate of return”), but also introduces noise into the decision-making process.
III.b Production response
– late 1970’s early 1980’s
Only
selected highlights relative to production response to fertilizers will be
presented. Focus is in obtaining rough parameters that allow inferences to be made on the role of
prices and overall technical change on observed increases
in the adoption of the fertilizer technology.
Economic
analysis of fertilizer demand in the wheat crop as of the early 1980s is found in Gallacher (1982).
This study focused on the main corn/soybean
area of the country. Increased yields for “average” fertilizer levels (40 kg/ha
elementary nitrogen) were 11 percent
of base yields
on high fertility soils, and
16 percent of base yields for soils of low fertility. Higher (80 kg/ha) levels resulted in increases ranging from 17
to 28 percent of base yields.
Percentage-wise yield increases are a positive function of fertilizer dose, as absolute yield
increases with fertilizer dose, while base yield remains
constant[2]. The higher fertilizer response observed in “new” as compared to “older” wheat varieties is
reported in Gallacher (1986). For the
case of phosphorous fertilizer, the Marginal Product (MP) schedule for “older” varieties MP = 8.6 − 0.06 P
(P = phosphorous dose per hectare) shifts
upward to MP = 12.9 − 0.06 P for the newer ones. This results in a significant increase in the “optimum”
fertilizer rate for “new” as compared to “old” varieties.
For
a relative price of 6 (phosphorous/wheat price) the profit maximizing fertilizer level is 12 kg/ha with the older,
as compared to 83 kg/ ha
for the newer ones. This result highlights the importance of technical change
(in this case, wheat germplasm) in determining usage of the fertilizer
input. Additional results of fertilizer response
in wheat production in the late 1970’s to early 1980’s
are reported in Gallacher (1986)[3].
Yield increases resulting from the application of 40
kg/ha on nitrogen are .68 and .82 tons/ hectare
for, respectively, Marcos Juarez and Pergamino, two important agricultural
areas of the country. Yield increases from the fertilizer dose used here for calculations (40 kg/ha)
represented, respectively 31 end 38 percent of
baseline (i.e no fertilizer) yield. Given the prevailing the fertilizer/wheat prices, profit maximizing nitrogen
fertilizer levels were respectively 40 and 60 kg/ha for these two areas.
Extrapolating these experimental results to commercial
farms, a substantial disequilibrium in nitrogen use is evident: farm-level fertilizer use in the early to
mid-1980s was extremely low, despite results such as those above suggesting opportunities for increased
use of these inputs. Risk aversion and lack of knowledge are two possible
factors explaining these results.
Evidence
presented above broadly suggests response to the fertilizer input in the early to mid-1980’s. These response results
are a function of crop production
knowledge incorporated into decision-making processes at that time. As mentioned previously, increases
in crop area, and in the production of
major grain crops occurred starting in the late 1980s – early 1990s. The 1980s thus represent
a period where Argentine agriculture transitions from a use of land characterized by
crop-pasture rotations to one where in many areas increased
emphasis is put on annual crops,
pastures being thus relegated to land with variable types of agronomic constraints. It is expected
that higher cropping
intensity will result
in declining soil fertility, and thus increased demands for the fertilizer input.
III.c Production response: late 1990’s to the present
Systematic research
on fertilizer response
started in the late 1960’s as
a result of a joint project between
INTA, CYMMIT and the Ford Foundation. A decade later, response models were available for selected areas of the country
(García and Darwich, 2009). Despite these early research efforts, take off in fertilizer use had to wait at least until the early
1990s, that is, two decades
later than when fertilizer research was initiated. High fertilizer
prices during the 1970s
and 1980s are the most likely explanation for this fact.
Interest in the fertilizer
input increased in the early 1980’s, leading to
additional applied agronomic research by both INTA as well as private groups. A swap program of fertilizers for
grain was implemented by the Mi nistry
of Agriculture in 1983, and the first large-coverage soil fertility maps were completed by INTA. The first manual
of soil fertility and fertilizer use was published in 1989 (García
and Darwich, p.428).
Crop area increased
modestly, if at all, during the 1980’s, but significantly during the
1990’s and, particularly in the
2000-2010 period. Area of major crops thus jumped from some 17 million
hectares in the 1980s, to 36 million in 2019. As mentioned previously, the doubling of crop area resulted in abandonment of the traditional crop-pasture rotation, as well
shift in land use from natural grasses and forest/scrubland
to crops. Agronomists are insistent on their concern related to increased “pressure” put by continuous
cropping on soils (see, e.g. Sainz Rosas
and others, 2019) and on the “deficit” resulting from fertilizer levels not covering nutrient
extraction by crops
(see Grassini and Monzón, 2021).
Although an important volume
of research related
to fertilizer use has been
completed since the 1990s (see,
e.g. Álvarez and others [2015],
Correndo, Boxler and García [2015], García and Salvagiotti [2009])
summarizing results for economic
analysis is not easy. Figure 11 in García and Darwich (p. 434) provide a starting point. Table 2, adapted from this
figure, reports yield estimates
for the fertilized and non-fertilized wheat crop (experimental results).
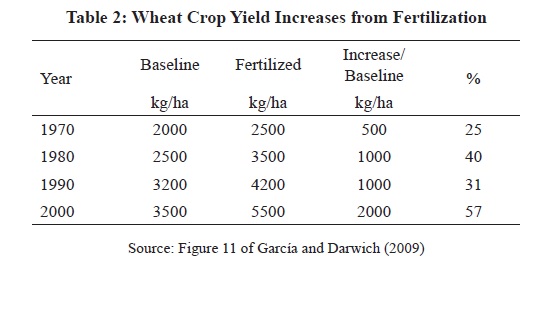
Two
issues stand out. First, in the period analyzed yields for the non-fertilized treatment increased 75
percent, most possibly as a result of improved seeds[4].
Second, response to the fertilizer input increased both in absolute
as well as relative terms:
the average product
of the fertilizer input was 500 kg/ha in 1970 (25 percent
of baseline yield),
but 2000 kg/ha in 2000 (57 percent of baseline). Although these –
admittedly “rough and ready”- result pertain
only to the wheat crop, they are illustrative of changes occurring in the Argentine agricultural sector.
García and Darwich (Table 10, p. 438) summarize the
“agronomic efficiency” of fertilizer
use in the wheat, corn and soybeans crops of Argentina. This term is used to denote additional output resulting from added input
(fertilizer). In the language of
microeconomics, the Average Product
(AP) resulting from the input. Fertilizer AP varies considerably among crops, nutrient and experimental trials. However, a first
approximation of 15 -20 kg/kg for wheat, 15-30 kg/kg for corn, and 12-20 kg/kg for soybeans
can be taken as a starting point.[5]
Opportunities opened
up by lower fertilizer prices,
as well as by technical developments related to fertilizer use result in an increase
in the demand for
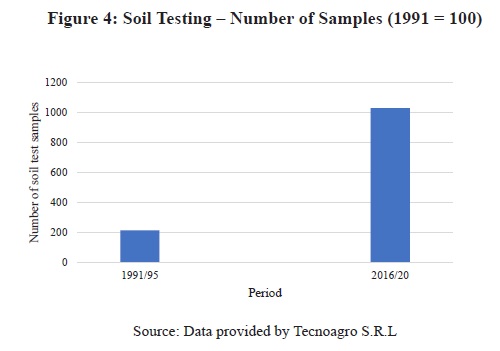
information leading to improved decision-making. Figure 4 shows an index of the number of soil samples
tested in a private laboratory in the 1991-
2020 period. Soil tests
increased nearly 400 percent between the beginning and the end of the period. The soil-testing lab from which this data originates
started operations in 1962, thus
growth in the 1991-2020 period most probably
reflects growth in demand for services, and not mere “growth in customer base”
due to recent starting of operations.
IV.
Accounting for the increase in fertilizer use
Total
growth in fertilizer use in Argentina in the 1990-2019 period results from (a) a doubling of crop area
and (b) increase in fertilizer use per unit
of crop area. To be explained here is the increase in fertilizer use per unit of area.
Two sub-periods are distinguished in these 3-decade period: 1990 –1999 and 2000-2019.
The
first (“Period 1”) is labelled “learning/adoption” stage, where (relatively recent) experimental and farm-level
results are gradually made available
to producers. Note that while fertilizer research was underway since the early
to mid-1970’s, it is only in the mid to late 1980’s that fertilizer prices
show a steady decline, thus making it “worthwhile” for producers
to
invest in information-gathering related
to use of this input.
Indeed, and as pointed out in the Griliches-Rogers
debate discussed earlier, it is only “rational”
to invest in information search if this information can be put to profitable use. This appears to have
happened when the fertilizer-wheat price
started to fall in the mid-1980s. Period 1 therefore marks the start of widespread adoption of fertilization in extensive crop production.
“Period
2” (2000-2019) corresponds to the “knowledge” stage, characterized by a
significant stock of agronomic research as well as on-farm experience related to fertilizer use.
Increased knowledge on the use of this input
suggests a decrease in the risk premium associated with allocating funds for fertilization. Further, gradual
crop intensification suggests tightening of constraints related to soil fertility.
Focus is placed on fertilizer use per unit of area. For a fixed input of
land and (non-fertilizer) input services complementary to land, output is assumed to result from:
Y(F) = A(t) F α
[4]
Where Y is output
per unit of land and F fertilizer input per unit of
land. A(t) results from overall improvements in technology or
technical change, a function of time. For simplicity, A(t) also includes the contribution of the non-fertilizer inputs such as land (assumed unchanging
through time). The profit (“B”)
maximizing level of input F results from equating input marginal
productivity to the relative input/output price:
B(F) = pA(t) Fα− wF [5]
dB/dF
= αp
A(t)F(α-1)−w =
0
[6]
F*(p,w) = [α (p/w) A(t)]1/(1-α)
[7]
Denoting by t = 0 or t = 1 for initial
and final stages of the two periods analyzed here (1990/99, 2000/19),
the predicted increase in the use of F is:
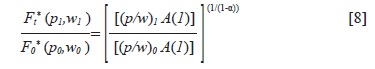
The
above can be decomposed in “’price effect” and a “technology effect”:
Price
effect = [(p/w)1/(p/w)0 ]1/(1-α)
[9]
Technology effect = [A(1)/A(0)]1/(1-α)
[10]
Expression [9], represents movement
along the derived
demand function for the fertilizer input. In turn, expression [10] captures the shifts in fertilizer demand resulting from shifts in “technology” (A(t)).
Changes in fertilizer demand are also a function of α,
the elasticity of output with respect to the fertilizer input. It is possible that α changes over time. This can occur via two channels. First, improved
soil diagnosis and fertilizer
application methods. Second, and probably more important, gradual decline in soil fertility due to
continuous cropping. As mentioned previously, evidence
of both these factors is available.
Impacts
of the above may be modelled by assuming α(t) = α0 (1
+ δ) where δ = 0 for the Period 1 (“learning/adoption” stage),
and δ >
0 for Period 2 (“knowledge” stage). A value of 0.3 will be assumed here for δ.
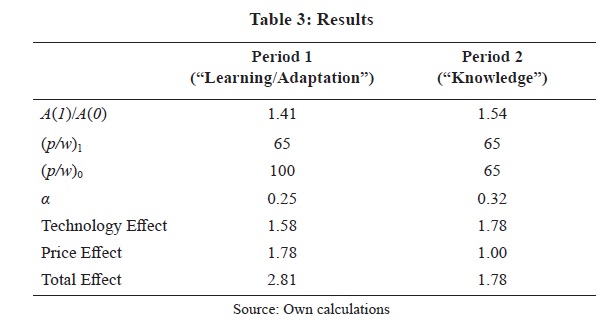
Table
3 reports assumed valued for price ratios, accumulated technical change for the
“learning adoption” and “knowledge” periods and output elasticity of the fertilizer input. As shown,
α is assumed equal to 0.25 in the
learning/adoption and 0.32 in the knowledge periods, respectively. The Appendix provides background for the
chosen values. Estimates of the impact of prices and technical change are also shown in Table 3.
In
Period 1 (1990-1990), real fertilizer prices fell from an index of 100 in the late 1980’s, to 65 a decade later.
Fertilizer use in this period nearly trebled
(x 2.81). As shown in Table 3, while this increase is accounted primarily by the reduction in the
fertilizer/crop price ratio, technical change
also played an important role.
In
turn, in the Period 2 (the “knowledge” period, 2000-2019), the effect of technical change results in fertilizer usage increasing by a factor
of 1.78. Technical change accounts for all of this increase, as the
relative fertilizer/crop price ratio remained unchanged during the period.
How
do these predictions compare with observed changes in the 1990-2019? In Period 1 (1990-1999), the
prediction increase (per-hectare) fertilizer demand
is somewhat lower than the observed increase
(181 vs 210 percent). In Period 2 (2000-2019), predicted change is very close to the observed
change (78 vs 82 percent). Overall observed increase
in the
1990-2019
period (470 percent) is higher than the one estimated here (400 percent). However, given the “rough and
ready” model used for estimation, results can be considered quite good.
Comparison
of “observed” with “estimated” figures should be made cautiously, as they are highly sensitive not only to assumptions
on technical change and fertilizer
output elasticity, but also on assumptions on prices used by farmers in the decision-making process: in particular
under the highly volatile economy of Argentina, ex-ante price expectations can
be quite different from what ex-post statistical data shows.
V. Final Comments
Argentine agriculture experienced significant growth in the last half-century. This has occurred despite
policies that resulted in a distortion of
the incentives faced by producers. This paper attempts to understand determinants of the fifteen-fold increase
in fertilizer use that has occurred since 1990. Evidence presented
her suggests that previous to the late 1980’s, unfavorable price ratios were a
significant constraint to fertilizer adoption.
But prices were not the only factor: incipient developments of
fertilizer use technology (in particular, soil testing), as well as variable and frequently low fertilizer response
were contributing factors.
During
the 1990’s, more favorable relative price ratios, significant improvements in overall crop productivity,
and increased cropping intensity (with
resulting increase in fertilizer response) triggered growth in fertilizer application per unit of land. As shown in
Figure 2, relatively low fertilizer/ crop prices during the 1990s were followed by two decades
of substantially rising (+ 50
percent or more) fertilizer prices. Fertilizer use, however, continued
to grow. An intriguing question
is the role that favorable prices on a given period
have in input use of subsequent periods: favorable prices encourage increased input use, and
indirectly, accumulation of knowledge related
to this technology. A possible hypothesis is that the economic liberalization
that occurred in Argentina in the 1990s, contributed to growth not only in this period but in subsequent
periods as well – a “catalyst” effect of the improvement in relative prices on subsequent input demand.
The
evidence presented in this paper suggests that both reductions in relative prices (in particular, in the
1990/99 period, as compared to the previous
decade) as well as overall
technical improvements were responsible for increased
fertilizer use. Crop productivity (and thus response to fertilizer) as a determinant of demand for the fertilizer input is particularly important after 2000, when despite variable or even
increasing real fertilizer prices, demand for this input continued
to increase.
The
fact that fertilizer demand is driven not only by relative prices, but by overall technology as reflected in
response to this input should not obscure
the fact that improvements in relative prices can have a significant impact on the overall output of the
Argentine agricultural sector. Indeed, the contrafactual that deserves attention
is what would output and output growth
would have been in the last two decades with Argentine relative prices similar
to those found in other major exporters.
Disentangling the effects of prices and input productivity in producer decision-making is a complex but
important research topic. Progress in
this area will most possibly
require close collaboration between professionals with
backgrounds in agronomy with those in economics. The important fertilizer price increases occurring in late
2021-early 2022 highlight the relevance of research aimed at understanding fertilizer demand
in Argentina. Further work on this topic can make useful progress taking as a starting point the “classical”
papers on fertilizer demand commented on the previous sections (Griliches, 1958 and 1959, Heady and Yeh, 1959).
VI.
References
Alvarez, R., H.S. Steinbach, C.R. Alvarez and J.L.De Pape
(2015). Fertilizer use in Pampean
Agroecosystems: Impact on Productivity and Nutrient Balance. Chemical Engineering Series – Fertilizer
Technology Vol.2: Biofertilizers. Eds S. Sinha, K.K. Pants, S. Bonpai and J.N.
Govil. Studium Press, USA.
Anderson, J.R., J.L. Dillon and J.B. Hardaker (1977). Agricultural
Decision Analysis. The Iowa
State University Press.
Beckman, J., M.Ivanic, J.Jelliffe, F.G.Baquedano and S.Scott (2020).
Economic and Food Security
Impacts of Agricultural Input Reduction Under the
European Union
Green Deal’s Farm to Fork and Biodiversity Strategies. USDA – ERS - Economic Brief No. (EB-30) 59 pp.
Cirio, F.M., I. Danelotti and D. White (1981).
Productividad, eficiencia y el problema
energético en la agricultura. Convenio AACREA-Banco de la Nación Argentina –Fundación Banco de la provincia de Buenos Aires. Año
4, Núm. 20.
Correndo, A.A., M.Boxler and F. García (2015). Análisis económico del manejo de la fertilización con un enfoque
en el largo plazo. Ciencia del Suelo (Argentina) 33(2): 197-212, 2015.
Fertilizar Asociación Civil, https://fertilizar.org.ar/estadisticas/#
Gallacher, M. (1982). Análisis económico de la fertilización de
trigo. Resultados de la zona maicera.
Convenio AACREA-Banco de la Nación Argentina – Fundación Banco de la
provincia de Buenos Aires.
Año 4, Número 24.
Gallacher, M. (1985). Nuevas tecnologías en la producción de
trigo-fertilizantes en la pradera
pampeana. Centro de Investigaciones sobre Política Agropecuaria. Documento de Trabajo de investigación Nro 4.
Gallacher, M. (1986). Implicancias económicas del cambio
tecnológico. Nuevas variedades en la región triguera
IV. Estudios Económicos, Nro 7/8 pp.1-11.
Gallacher, M. (1987). Perspectivas de la producción de granos en
la pradera pampeana. Estudio sobre políticas de producción, transporte,
almacenamiento y embarque de granos.
Instituto Interamericano de Cooperación para la Agricultura (IICA) Junio 1987.
García, F. and N. Darwich (2009). La fertilización: tecnología
para sostener la productividad de nuestros
suelos. In: D. Ricci (2009),
La revolución tecnológica del agro. Hacia
el desarrollo integral
de nuestra sociedad. CASAFE.
García, F. and F. Salvagiotti (2009). Eficiencia en el uso de
nutrientes en sistemas agrícolas del Cono sur de Latinoamerica. In: J. Espinosa
and F. Garcia (ed.). Memorias
del Simposio "Uso
eficiente de nutrientes". XVIII Congreso Lati
noamericano de la Ciencia del Suelo. San José, Costa
Rica. pp. 37-48.
Garcia, F., J. Minteguiaga , R.
Pozzi, (2010). La red de nutrición de la región Crea Sur de Santa Fe: Resultados y conclusiones de los primeros diez
años 200- 2009. 1a ed. - Buenos Aires: Asoc. Argentina de Consorcios. Regionales de
Experimentación Agrícola - AACREA,
2010.
Grassini, P. and J.P Monzón (2021). De brechas de rendimientos a brechas de nutrientes. Diagnóstico para la Argentina. Conference
in the Academia Nacional de Agronomía y Veterinaria. Buenos
Aires, June 15, 2021.
Griliches, Z. (1958). The demand for fertilizer: an economic
interpretation of a technical change. Journal
of Farm Economics (40): 591-605.
Griliches, Z. (1959). Distributed lags, disaggregation and
regional demand functions for fertilizer. Journal of Farm Economics (41):90-102.
Griliches, Z. (1962). ‘Profitability Versus Interaction: Another False Dichotomy,” Rural Sociology, vol. 27, pp. 325‐330.
Heady, E.O. y M.H.Yeh (1959). National and regional demand
functions for fertilizer. Journal
of Farm Economics (41): 332-348.
Hayami, Y and V.W. Ruttan (1985). Agricultural
Development: An International Perspective. Baltimore: Johns Hopkins Univ.
Huffman, W.E. (1977). Allocative efficiency: the role of
human capital. Quarterly Journal
of Economics (91): 59-77.
Huffman, W. E.(2000). Human Capital, Education, and
Agriculture. Economic Staff Paper
Series. 341.
Disponible en: http://lib.dr.iastate.edu/econ_las_staffpa- pers/341
Kahneman, D. and A.Tversky (1979).
Prospect theory: an analysis of decision under
risk. Econometrica Vol. 47, No. 2 (Mar.), pp. 263-291.
Lema, D.R. (2016). Crecimiento y productividad total de factores
en la agricultura argentina y del
Cono Sur 1961-2913. Serie de informes técnicos del Banco Mundial en Argentina, Paraguay y Uruguay Nº 1, 2015.
Márgenes Agropecuarios (2002/2020). www.margenes.com
Reca, L. G. (2006).
El sector agropecuario argentino: despegue, caída
y resurgimiento (1875 y 2005).
Estudios
Económicos 23(47).
Rogers, E.M. and A. E. Havens (1962), “Rejoinder to
Griliches’ ‘Another False Di- chotomy,” Rural Sociology, vol. 27: pp. 332-334.
Sainz Rozas, H. M. Eyherabide, G. Larrea, N. Martínez Cuesta, H. Angelini, N. Reussi
Calvo y N. Wyngaard (2019).
Relevamiento y determinación de propiedades químicas en suelos de aptitud agrícola
de la región pampeana. Simposio Fertilizar Asociación Civil. Buenos
Aires.
Schultz, T.W. (1956). Reflections on agricultural production, output and supply. Journal of Farm Economics (38
No 3):748-762.
Schultz, T.W. (1964).
Transforming traditional agriculture. Yale
University Press.
Schultz, T.W. (1975), The value of the ability to deal with
disequilibria. Journal of Economic Literature (13):827-846.
Stewart, W.M., D.W. Dibb. A.E. Johnston and T.J.Smyth
(2005). The contribution of
commercial fertilizer nutrients to food production. Agronomy Journal (97):
1-6.
VII.
Appendix
Assumed values for
technical change (A(t)), relative prices (w/p) and fertilizer output elasticity (α)
Technical change (A(t))
Lema (2016)
reports estimates of TFP change
in Argentine agricultu re during the last decades.
Table 3 summarized results as follows:
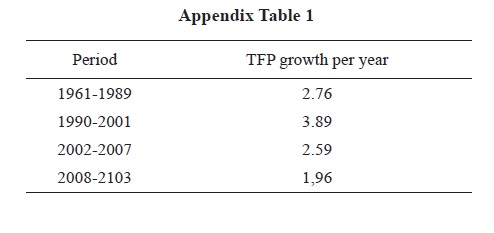
For
Period 1 (1990-99) the value of 3.89 per year reported by Lema is used. For Period 2 (2000-2019) the
average estimated by Lema for the 2002-2007
and 2008-2013 (2.3 % per year) are taken as representative. To tal TFP change is thus 41 percent for Period 1 (1.03899 – 1) and 54 percent
(1.02319 – 1) for Period 2.
Relative prices (w/p)
An index of fertilizer/crop prices is used. For year t fertilizer (Pf) and crop price (Pc) indexes are, respectively:
 [A.1]
[A.1]
Where
Pn and Pp correspond, respectively to pert-on price (US$) of nitrogen (urea) and phosphorous
(diammonium phosphate) fertilizers, and weights
correspond to approximate shares of these two inputs in the Argentine fertilizer
market.
 [A.2]
[A.2]
Where p and q correspond respectively to prices and quantities, and i= 1….3 correspond to the three crops considered (corn, wheat and soybeans) The resulting input/output price ratio is then:
(  =
=  [A.3]
[A.3]
Prices
were obtained from Márgenes Agropecuarios (several years).
Using calculated relative
prices:
Period
1: Price ratio of 100 was assumed at the beginning of the period (prevailing price late 1980s, early
1990s). Price ratio of 65 follows from calculations for the end of the period.
Period 2:
Price ratio of 65 follows from calculations for both the beginning (2000-2004) as well as the end (2016-2019) of the period.
Fertilizer Output Elasticity (α)
Only
rough estimates of elasticity of output with respect to fertilizer application are available. Some figures
are reported in Section III of this report. The objective here is not to attempt
to obtain “the” relevant value for
α for the Argentine agricultural sector, but only to discuss possible implications
of input marginal productivity and prices in explaining shifts in fertilizer use. The following are some
examples that have been commented in Section
III (yield increases
resulting from fertilizer use):
Overall
assessment by García and Darwich (2009) indicate “agronomic efficiency” (i.e
Average Product) of fertilizer use of 15-20 for wheat, 15-30 for corn and 12-20 for soybeans. Assuming an input use of
60 kg/ha for wheat and corn, and 40
kg/ha for soybeans, this would result in yield
increases of 900-1200, 900-1800 and 480-800 kg/ha for the three crops considered here. These increments
represent, respectively 27-36; 15-30 and 18
– 30 percent of country-wide yields. Note
that all “elasticity” values reported
here result from experimental plots and not farmer fields. Farmer response
can be expected to be somewhat lower
due to managerial and constraints operating on the system.
As a result of the evidence presented above, and admittedly
in an ad- hoc manner,
a value of α=0.25 will be assumed
for Period 1, and α=0.25(1
+δ) = 0.25(1 +0.3 ) = 0.32
for Period 2.
Fertilizer usage per hectare
Fertilizer
use data is reported by Fertilizar Asociación Civil. Area of major crops by the
Ministry of Agriculture (SAGPyA).
For
Period 1, increase in fertilizer is expresses as the ratio between the 1998-2000 and 1990-1992 average annual
use per hectare of land sown to the main grain crops (rice,
soybeans, peanuts, wheat,
soybeans, sunflower, grain sorghum and barley). For Period 2,
the ratio between 2018-2020 and 2000-2002
averages is used.
 Revista de Economía y Estadística | Vol. LX | N° 1 | 2022 | pp. 55-78 | ISSN 0034-8066 | e-ISSN 2451-7321|